Time Warner Cable 2014 Annual Report Download - page 116
Download and view the complete annual report
Please find page 116 of the 2014 Time Warner Cable annual report below. You can navigate through the pages in the report by either clicking on the pages listed below, or by using the keyword search tool below to find specific information within the annual report.-
 1
1 -
2
-
3
-
4
-
5
-
6
-
7
-
8
-
9
-
10
-
11
-
12
-
13
-
14
-
15
-
16
-
17
-
18
-
19
-
20
-
21
-
22
-
23
-
24
-
25
-
26
-
27
-
28
-
29
-
30
-
31
-
32
-
33
-
34
-
35
-
36
-
37
-
38
-
39
-
40
-
41
-
42
-
43
-
44
-
45
-
46
-
47
-
48
-
49
-
50
-
51
-
52
-
53
-
54
-
55
-
56
-
57
-
58
-
59
-
60
-
61
-
62
-
63
-
64
-
65
-
66
-
67
-
68
-
69
-
70
-
71
-
72
-
73
-
74
-
75
-
76
-
77
-
78
-
79
-
80
-
81
-
82
-
83
-
84
-
85
-
86
-
87
-
88
-
89
-
90
-
91
-
92
-
93
-
94
-
95
-
96
-
97
-
98
-
99
-
100
-
101
-
102
-
103
-
104
-
105
-
 106
106 -
 107
107 -
 108
108 -
 109
109 -
 110
110 -
 111
111 -
 112
112 -
 113
113 -
 114
114 -
 115
115 -
 116
116 -
 117
117 -
 118
118 -
 119
119 -
 120
120 -
 121
121 -
 122
122 -
 123
123 -
 124
124 -
 125
125 -
 126
126 -
127
-
128
-
129
-
130
-
131
-
132
-
133
-
134
-
135
-
136
-
137
-
138
-
139
-
140
-
141
-
142
-
143
-
144
-
145
-
146
-
147
-
148
-
149
-
150
 |
 |

TIME WARNER CABLE INC.
NOTES TO CONSOLIDATED FINANCIAL STATEMENTS—(Continued)
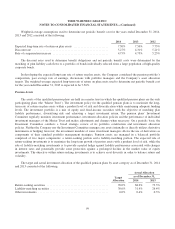
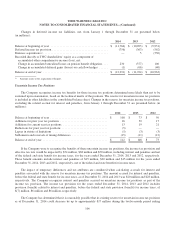
reportable segment. As such, the reportable segment results reflect how management views such segments in assessing
financial performance and allocating resources and are not necessarily indicative of the results of operations that each
segment would have achieved had they operated as stand-alone entities during the periods presented.
In evaluating the profitability of the Company’s segments, the components of net income (loss) below OIBDA, as
defined below, are not separately evaluated by management at the segment level. Due to the nature of the Company’s
operations, a majority of its assets, including its distribution systems, are utilized across the Company’s operations and are
not segregated by segment. In addition, segment assets are not reported to, or used by, management to allocate resources
or assess the performance of the Company’s segments. Accordingly, the Company has not disclosed asset information by
segment.
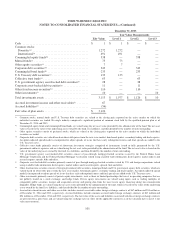
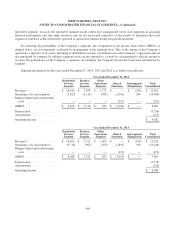
Segment information for the years ended December 31, 2014, 2013 and 2012 is as follows (in millions):
Year Ended December 31, 2014
Residential
Services
Segment
Business
Services
Segment
Other
Operations
Segment
Shared
Functions
Intersegment
Eliminations
Total
Consolidated
Revenue(a) ..................... $ 18,446 $ 2,838 $ 1,772 $ — $ (244) $ 22,812
Operating costs and expenses ...... (9,823) (1,119) (985) (2,901) 244 (14,584)
Merger-related and restructuring
costs ........................ — — — (225) — (225)
OIBDA ....................... $ 8,623 $ 1,719 $ 787 $ (3,126) $ — 8,003
Depreciation ................... (3,236)
Amortization ................... (135)
Operating Income ............... $ 4,632
Year Ended December 31, 2013
Residential
Services
Segment
Business
Services
Segment
Other
Operations
Segment
Shared
Functions
Intersegment
Eliminations
Total
Consolidated
Revenue(a) ..................... $ 18,402 $ 2,312 $ 1,602 $ — $ (196) $ 22,120
Operating costs and expenses ...... (9,714) (961) (769) (2,892) 196 (14,140)
Merger-related and restructuring
costs ........................ — — — (119) — (119)
OIBDA ....................... $ 8,688 $ 1,351 $ 833 $ (3,011) $ — 7,861
Depreciation ................... (3,155)
Amortization ................... (126)
Operating Income ............... $ 4,580
108