Time Warner Cable 2014 Annual Report Download - page 57
Download and view the complete annual report
Please find page 57 of the 2014 Time Warner Cable annual report below. You can navigate through the pages in the report by either clicking on the pages listed below, or by using the keyword search tool below to find specific information within the annual report.-
 1
1 -
2
-
3
-
4
-
5
-
6
-
7
-
8
-
9
-
10
-
11
-
12
-
13
-
14
-
15
-
16
-
17
-
18
-
19
-
20
-
21
-
22
-
23
-
24
-
25
-
26
-
27
-
28
-
29
-
30
-
31
-
32
-
33
-
34
-
35
-
36
-
37
-
38
-
39
-
40
-
41
-
42
-
43
-
44
-
45
-
46
-
 47
47 -
 48
48 -
 49
49 -
 50
50 -
 51
51 -
 52
52 -
 53
53 -
 54
54 -
 55
55 -
 56
56 -
 57
57 -
 58
58 -
 59
59 -
 60
60 -
 61
61 -
 62
62 -
 63
63 -
 64
64 -
 65
65 -
 66
66 -
 67
67 -
68
-
69
-
70
-
71
-
72
-
73
-
74
-
75
-
76
-
77
-
78
-
79
-
80
-
81
-
82
-
83
-
84
-
85
-
86
-
87
-
88
-
89
-
90
-
91
-
92
-
93
-
94
-
95
-
96
-
97
-
98
-
99
-
100
-
101
-
102
-
103
-
104
-
105
-
106
-
107
-
108
-
109
-
110
-
111
-
112
-
113
-
114
-
115
-
116
-
117
-
118
-
119
-
120
-
121
-
122
-
123
-
124
-
125
-
126
-
127
-
128
-
129
-
130
-
131
-
132
-
133
-
134
-
135
-
136
-
137
-
138
-
139
-
140
-
141
-
142
-
143
-
144
-
145
-
146
-
147
-
148
-
149
-
150
 |
 |

TIME WARNER CABLE INC.
MANAGEMENT’S DISCUSSION AND ANALYSIS OF RESULTS
OF OPERATIONS AND FINANCIAL CONDITION—(Continued)
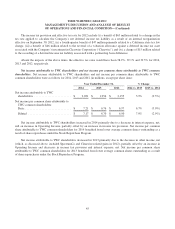
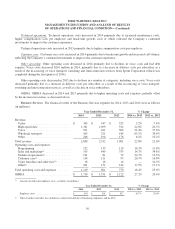
Residential high-speed data revenue increased in 2013 due to growth in average revenue per subscriber and an
increase in high-speed data subscribers, as well as two additional months of Insight revenue, which totaled $47 million.
The increase in average revenue per subscriber was primarily due to an increase in equipment rental charges and a greater
percentage of subscribers purchasing higher-priced tiers of service.
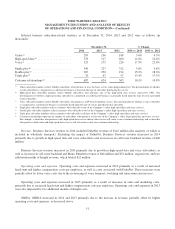
Voice. The decrease in residential voice revenue in 2014 was primarily due to a decrease in average revenue per
subscriber, partially offset by growth in voice subscribers.
The decrease in residential voice revenue in 2013 was due to a decline in average revenue per subscriber and fewer
voice subscribers, partially offset by two additional months of Insight revenue, which totaled $24 million.
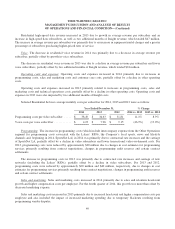
Operating costs and expenses. Operating costs and expenses increased in 2014 primarily due to increases in
programming costs, sales and marketing costs and customer care costs, partially offset by a decline in other operating
costs.
Operating costs and expenses increased in 2013 primarily related to increases in programming costs, sales and
marketing costs and technical operations costs, partially offset by a decline in other operating costs. Operating costs and
expenses in 2013 were also impacted by two additional months of Insight costs.
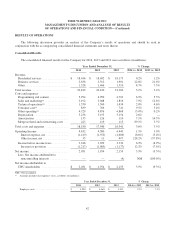
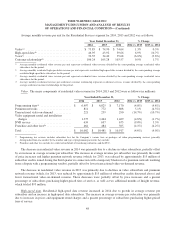
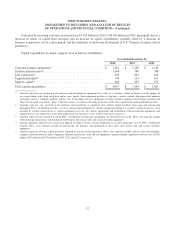
Selected Residential Services average monthly costs per subscriber for 2014, 2013 and 2012 were as follows:
Year Ended December 31, % Change
2014 2013 2012 2014 vs. 2013 2013 vs. 2012
Programming costs per video subscriber ..... $ 38.49 $ 34.63 $ 31.81 11.1% 8.9%
Voice costs per voice subscriber ............ $ 4.23 $ 7.96 $ 9.15 (46.9%) (13.0%)
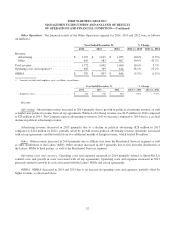
Programming. The increase in programming costs (which include intercompany expense from the Other Operations
segment for programming costs associated with the Lakers’ RSNs, the Company’s local sports, news and lifestyle
channels and, beginning in 2014, SportsNet LA) in 2014 was primarily due to contractual rate increases and the carriage
of SportsNet LA, partially offset by a decline in video subscribers and lower transactional video-on-demand costs. For
2013, programming costs were reduced by approximately $20 million due to changes in cost estimates for programming
services primarily resulting from contract negotiations, changes in programming audit reserves and certain contract
settlements.
The increase in programming costs in 2013 was primarily due to contractual rate increases and carriage of new
networks (including the Lakers’ RSNs), partially offset by a decline in video subscribers. For 2013 and 2012,
programming costs were reduced by approximately $20 million and $40 million, respectively, due to changes in cost
estimates for programming services primarily resulting from contract negotiations, changes in programming audit reserves
and certain contract settlements.
Sales and marketing. Sales and marketing costs increased in 2014 primarily due to sales and retention headcount
growth and higher compensation costs per employee. For the fourth quarter of 2014, this growth was more than offset by
decreased marketing expense.
Sales and marketing costs increased in 2013 primarily due to increased headcount and higher compensation costs per
employee and also included the impact of increased marketing spending due to temporary blackouts resulting from
programming vendor disputes.
49