Time Warner Cable 2014 Annual Report Download - page 50
Download and view the complete annual report
Please find page 50 of the 2014 Time Warner Cable annual report below. You can navigate through the pages in the report by either clicking on the pages listed below, or by using the keyword search tool below to find specific information within the annual report.-
 1
1 -
2
-
3
-
4
-
5
-
6
-
7
-
8
-
9
-
10
-
11
-
12
-
13
-
14
-
15
-
16
-
17
-
18
-
19
-
20
-
21
-
22
-
23
-
24
-
25
-
26
-
27
-
28
-
29
-
30
-
31
-
32
-
33
-
34
-
35
-
36
-
37
-
38
-
39
-
 40
40 -
 41
41 -
 42
42 -
 43
43 -
 44
44 -
 45
45 -
 46
46 -
 47
47 -
 48
48 -
 49
49 -
 50
50 -
 51
51 -
 52
52 -
 53
53 -
 54
54 -
 55
55 -
 56
56 -
 57
57 -
 58
58 -
 59
59 -
 60
60 -
61
-
62
-
63
-
64
-
65
-
66
-
67
-
68
-
69
-
70
-
71
-
72
-
73
-
74
-
75
-
76
-
77
-
78
-
79
-
80
-
81
-
82
-
83
-
84
-
85
-
86
-
87
-
88
-
89
-
90
-
91
-
92
-
93
-
94
-
95
-
96
-
97
-
98
-
99
-
100
-
101
-
102
-
103
-
104
-
105
-
106
-
107
-
108
-
109
-
110
-
111
-
112
-
113
-
114
-
115
-
116
-
117
-
118
-
119
-
120
-
121
-
122
-
123
-
124
-
125
-
126
-
127
-
128
-
129
-
130
-
131
-
132
-
133
-
134
-
135
-
136
-
137
-
138
-
139
-
140
-
141
-
142
-
143
-
144
-
145
-
146
-
147
-
148
-
149
-
150
 |
 |

TIME WARNER CABLE INC.
MANAGEMENT’S DISCUSSION AND ANALYSIS OF RESULTS
OF OPERATIONS AND FINANCIAL CONDITION—(Continued)
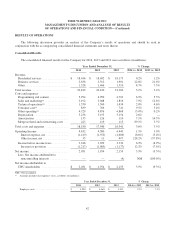
RESULTS OF OPERATIONS
The following discussion provides an analysis of the Company’s results of operations and should be read in
conjunction with the accompanying consolidated financial statements and notes thereto.
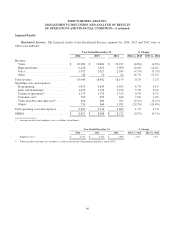
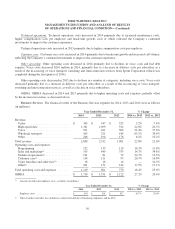
Consolidated Results
The consolidated financial results for the Company for 2014, 2013 and 2012 were as follows (in millions):
Year Ended December 31, % Change
2014 2013 2012 2014 vs. 2013 2013 vs. 2012
Revenue:
Residential services ................. $ 18,446 $ 18,402 $ 18,175 0.2% 1.2%
Business services ................... 2,838 2,312 1,901 22.8% 21.6%
Other ............................. 1,528 1,406 1,310 8.7% 7.3%
Total revenue ........................ 22,812 22,120 21,386 3.1% 3.4%
Costs and expenses:
Programming and content ............ 5,294 4,950 4,703 6.9% 5.3%
Sales and marketing(a) ............... 2,192 2,048 1,816 7.0% 12.8%
Technical operations(a) ............... 1,530 1,500 1,434 2.0% 4.6%
Customer care(a) .................... 839 766 741 9.5% 3.4%
Other operating(a) ................... 4,729 4,876 4,868 (3.0%) 0.2%
Depreciation ....................... 3,236 3,155 3,154 2.6% —
Amortization ...................... 135 126 110 7.1% 14.5%
Merger-related and restructuring costs . . 225 119 115 89.1% 3.5%
Total costs and expenses ............... 18,180 17,540 16,941 3.6% 3.5%
Operating Income ..................... 4,632 4,580 4,445 1.1% 3.0%
Interest expense, net ............... (1,419) (1,552) (1,606) (8.6%) (3.4%)
Other income, net ................. 35 11 497 218.2% (97.8%)
Income before income taxes .......... 3,248 3,039 3,336 6.9% (8.9%)
Income tax provision .............. (1,217) (1,085) (1,177) 12.2% (7.8%)
Net income .......................... 2,031 1,954 2,159 3.9% (9.5%)
Less: Net income attributable to
noncontrolling interests ............ — — (4) NM (100.0%)
Net income attributable to
TWC shareholders .................. $ 2,031 $ 1,954 $ 2,155 3.9% (9.3%)
NM—Not meaningful.
(a) Amounts include total employee costs, as follows (in millions):
Year Ended December 31, % Change
2014 2013 2012 2014 vs. 2013 2013 vs. 2012
Employee costs ........................... $ 4,990 $ 4,860 $ 4,531 2.7% 7.3%
42