Time Warner Cable 2014 Annual Report Download - page 54
Download and view the complete annual report
Please find page 54 of the 2014 Time Warner Cable annual report below. You can navigate through the pages in the report by either clicking on the pages listed below, or by using the keyword search tool below to find specific information within the annual report.-
 1
1 -
2
-
3
-
4
-
5
-
6
-
7
-
8
-
9
-
10
-
11
-
12
-
13
-
14
-
15
-
16
-
17
-
18
-
19
-
20
-
21
-
22
-
23
-
24
-
25
-
26
-
27
-
28
-
29
-
30
-
31
-
32
-
33
-
34
-
35
-
36
-
37
-
38
-
39
-
40
-
41
-
42
-
43
-
 44
44 -
 45
45 -
 46
46 -
 47
47 -
 48
48 -
 49
49 -
 50
50 -
 51
51 -
 52
52 -
 53
53 -
 54
54 -
 55
55 -
 56
56 -
 57
57 -
 58
58 -
 59
59 -
 60
60 -
 61
61 -
 62
62 -
 63
63 -
 64
64 -
65
-
66
-
67
-
68
-
69
-
70
-
71
-
72
-
73
-
74
-
75
-
76
-
77
-
78
-
79
-
80
-
81
-
82
-
83
-
84
-
85
-
86
-
87
-
88
-
89
-
90
-
91
-
92
-
93
-
94
-
95
-
96
-
97
-
98
-
99
-
100
-
101
-
102
-
103
-
104
-
105
-
106
-
107
-
108
-
109
-
110
-
111
-
112
-
113
-
114
-
115
-
116
-
117
-
118
-
119
-
120
-
121
-
122
-
123
-
124
-
125
-
126
-
127
-
128
-
129
-
130
-
131
-
132
-
133
-
134
-
135
-
136
-
137
-
138
-
139
-
140
-
141
-
142
-
143
-
144
-
145
-
146
-
147
-
148
-
149
-
150
 |
 |

TIME WARNER CABLE INC.
MANAGEMENT’S DISCUSSION AND ANALYSIS OF RESULTS
OF OPERATIONS AND FINANCIAL CONDITION—(Continued)
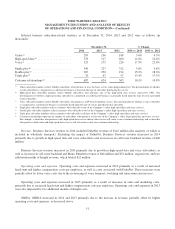
Segment Results
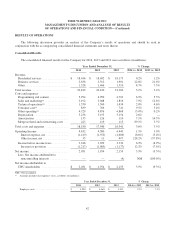
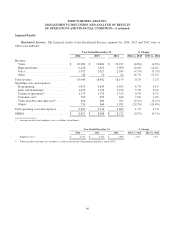
Residential Services. The financial results of the Residential Services segment for 2014, 2013 and 2012 were as
follows (in millions):
Year Ended December 31, % Change
2014 2013 2012 2014 vs. 2013 2013 vs. 2012
Revenue:
Video ............................ $ 10,002 $ 10,481 $ 10,917 (4.6%) (4.0%)
High-speed data .................... 6,428 5,822 5,090 10.4% 14.4%
Voice ............................ 1,932 2,027 2,104 (4.7%) (3.7%)
Other ............................ 84 72 64 16.7% 12.5%
Total revenue ........................ 18,446 18,402 18,175 0.2% 1.2%
Operating costs and expenses:
Programming ...................... 5,075 4,845 4,652 4.7% 4.1%
Sales and marketing(a) ............... 1,470 1,396 1,276 5.3% 9.4%
Technical operations(a) .............. 1,379 1,370 1,313 0.7% 4.3%
Customer care(a) .................... 705 655 646 7.6% 1.4%
Video franchise and other fees(b) ....... 464 484 505 (4.1%) (4.2%)
Other(a) ........................... 730 964 1,071 (24.3%) (10.0%)
Total operating costs and expenses ....... 9,823 9,714 9,463 1.1% 2.7%
OIBDA ............................ $ 8,623 $ 8,688 $ 8,712 (0.7%) (0.3%)
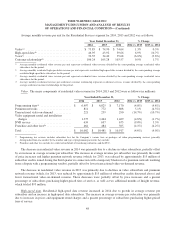
(a) Amounts include total employee costs, as follows (in millions):
Year Ended December 31, % Change
2014 2013 2012 2014 vs. 2013 2013 vs. 2012
Employee costs ........................... $ 2,743 $ 2,633 $ 2,498 4.2% 5.4%
(b) Video franchise and other fees include fees collected on behalf of franchising authorities and the FCC.
46