Time Warner Cable 2014 Annual Report Download - page 118
Download and view the complete annual report
Please find page 118 of the 2014 Time Warner Cable annual report below. You can navigate through the pages in the report by either clicking on the pages listed below, or by using the keyword search tool below to find specific information within the annual report.-
 1
1 -
2
-
3
-
4
-
5
-
6
-
7
-
8
-
9
-
10
-
11
-
12
-
13
-
14
-
15
-
16
-
17
-
18
-
19
-
20
-
21
-
22
-
23
-
24
-
25
-
26
-
27
-
28
-
29
-
30
-
31
-
32
-
33
-
34
-
35
-
36
-
37
-
38
-
39
-
40
-
41
-
42
-
43
-
44
-
45
-
46
-
47
-
48
-
49
-
50
-
51
-
52
-
53
-
54
-
55
-
56
-
57
-
58
-
59
-
60
-
61
-
62
-
63
-
64
-
65
-
66
-
67
-
68
-
69
-
70
-
71
-
72
-
73
-
74
-
75
-
76
-
77
-
78
-
79
-
80
-
81
-
82
-
83
-
84
-
85
-
86
-
87
-
88
-
89
-
90
-
91
-
92
-
93
-
94
-
95
-
96
-
97
-
98
-
99
-
100
-
101
-
102
-
103
-
104
-
105
-
106
-
107
-
 108
108 -
 109
109 -
 110
110 -
 111
111 -
 112
112 -
 113
113 -
 114
114 -
 115
115 -
 116
116 -
 117
117 -
 118
118 -
 119
119 -
 120
120 -
 121
121 -
 122
122 -
 123
123 -
 124
124 -
 125
125 -
 126
126 -
 127
127 -
 128
128 -
129
-
130
-
131
-
132
-
133
-
134
-
135
-
136
-
137
-
138
-
139
-
140
-
141
-
142
-
143
-
144
-
145
-
146
-
147
-
148
-
149
-
150
 |
 |

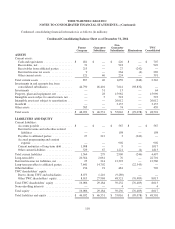
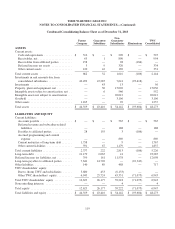
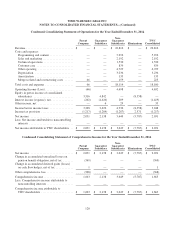
TIME WARNER CABLE INC.
NOTES TO CONSOLIDATED FINANCIAL STATEMENTS—(Continued)
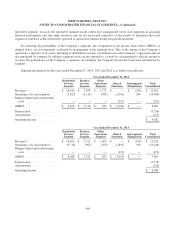
Revenue for the years ended December 31, 2014, 2013 and 2012 was derived from the following sources (in
millions):
Year Ended December 31,
2014 2013 2012
Residential Services revenue:
Video ..................................................... $ 10,002 $ 10,481 $ 10,917
High-speed data ............................................. 6,428 5,822 5,090
Voice ..................................................... 1,932 2,027 2,104
Other ..................................................... 84 72 64
Total Residential Services revenue ................................ 18,446 18,402 18,175
Business Services revenue:
Video ..................................................... 365 347 323
High-speed data ............................................. 1,341 1,099 912
Voice ..................................................... 511 421 306
Wholesale transport .......................................... 415 251 184
Other ..................................................... 206 194 176
Total Business Services revenue .................................. 2,838 2,312 1,901
Other Operations revenue:
Advertising ................................................ 1,127 1,019 1,053
Other ..................................................... 645 583 407
Total Other Operations revenue .................................. 1,772 1,602 1,460
Intersegment eliminations ....................................... (244) (196) (150)
Total revenue ................................................. $ 22,812 $ 22,120 $ 21,386
Use of OIBDA
Management uses Operating Income before Depreciation and Amortization (“OIBDA”), among other measures, in
evaluating the segment’s performance because it eliminates the effects of (i) considerable amounts of noncash
depreciation and amortization and (ii) items not within the control of the Company’s operations managers (such as income
tax provision, other income (expense), net, and interest expense, net). Management also uses this measure to evaluate the
Company’s consolidated operating performance and to allocate resources and capital to the segments. Performance
measures derived from OIBDA are also used in the Company’s annual incentive compensation programs. In addition, this
measure is commonly used by analysts, investors and others in evaluating the Company’s performance.
This measure has inherent limitations. For example, OIBDA does not reflect capital expenditures or the periodic
costs of certain capitalized assets used in generating revenue. To compensate for such limitations, management evaluates
the Company’s consolidated performance through, among other measures, various cash flow measures, which reflect
capital expenditure decisions, and net income attributable to TWC shareholders, which reflects the periodic costs of
capitalized assets. OIBDA also fails to reflect the significant costs borne by the Company for income taxes and debt
servicing costs, the results of the Company’s equity investments and other non-operational income or expense.
Management compensates for these limitations by using other analytics such as a review of net income attributable to
TWC shareholders.
This non-GAAP measure should be considered in addition to, not as a substitute for, the Company’s Operating
Income and net income attributable to TWC shareholders, as well as other measures of financial performance reported in
accordance with GAAP, and may not be comparable to similarly titled measures used by other companies.
110