Time Warner Cable 2014 Annual Report Download - page 56
Download and view the complete annual report
Please find page 56 of the 2014 Time Warner Cable annual report below. You can navigate through the pages in the report by either clicking on the pages listed below, or by using the keyword search tool below to find specific information within the annual report.-
 1
1 -
2
-
3
-
4
-
5
-
6
-
7
-
8
-
9
-
10
-
11
-
12
-
13
-
14
-
15
-
16
-
17
-
18
-
19
-
20
-
21
-
22
-
23
-
24
-
25
-
26
-
27
-
28
-
29
-
30
-
31
-
32
-
33
-
34
-
35
-
36
-
37
-
38
-
39
-
40
-
41
-
42
-
43
-
44
-
45
-
 46
46 -
 47
47 -
 48
48 -
 49
49 -
 50
50 -
 51
51 -
 52
52 -
 53
53 -
 54
54 -
 55
55 -
 56
56 -
 57
57 -
 58
58 -
 59
59 -
 60
60 -
 61
61 -
 62
62 -
 63
63 -
 64
64 -
 65
65 -
 66
66 -
67
-
68
-
69
-
70
-
71
-
72
-
73
-
74
-
75
-
76
-
77
-
78
-
79
-
80
-
81
-
82
-
83
-
84
-
85
-
86
-
87
-
88
-
89
-
90
-
91
-
92
-
93
-
94
-
95
-
96
-
97
-
98
-
99
-
100
-
101
-
102
-
103
-
104
-
105
-
106
-
107
-
108
-
109
-
110
-
111
-
112
-
113
-
114
-
115
-
116
-
117
-
118
-
119
-
120
-
121
-
122
-
123
-
124
-
125
-
126
-
127
-
128
-
129
-
130
-
131
-
132
-
133
-
134
-
135
-
136
-
137
-
138
-
139
-
140
-
141
-
142
-
143
-
144
-
145
-
146
-
147
-
148
-
149
-
150
 |
 |

TIME WARNER CABLE INC.
MANAGEMENT’S DISCUSSION AND ANALYSIS OF RESULTS
OF OPERATIONS AND FINANCIAL CONDITION—(Continued)
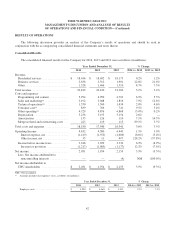
Average monthly revenue per unit for the Residential Services segment for 2014, 2013 and 2012 was as follows:
Year Ended December 31, % Change
2014 2013 2012 2014 vs. 2013 2013 vs. 2012
Video(a) ...................................... $ 75.85 $ 74.90 $ 74.64 1.3% 0.3%
High-speed data(b) .............................. 46.95 43.92 39.66 6.9% 10.7%
Voice(c) ...................................... 32.35 34.40 35.68 (6.0%) (3.6%)
Customer relationship(d) ......................... 106.24 105.28 103.57 0.9% 1.7%
(a) Average monthly residential video revenue per unit represents residential video revenue divided by the corresponding average residential video
subscribers for the period.
(b) Average monthly residential high-speed data revenue per unit represents residential high-speed data revenue divided by the corresponding average
residential high-speed data subscribers for the period.
(c) Average monthly residential voice revenue per unit represents residential voice revenue divided by the corresponding average residential voice
subscribers for the period.
(d) Average monthly residential revenue per residential customer relationship represents residential services revenue divided by the corresponding
average residential customer relationships for the period.
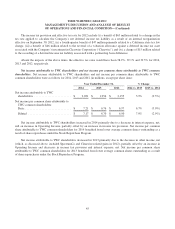
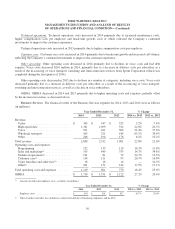
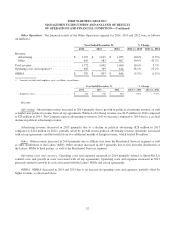
Video. The major components of residential video revenue for 2014, 2013 and 2012 were as follows (in millions):
Year Ended December 31, % Change
2014 2013 2012 2014 vs. 2013 2013 vs. 2012
Programming tiers(a) ..................... $ 6,497 $ 6,825 $ 7,170 (4.8%) (4.8%)
Premium networks ...................... 811 772 808 5.1% (4.5%)
Transactional video-on-demand ............ 221 259 290 (14.7%) (10.7%)
Video equipment rental and installation
charges ............................. 1,375 1,444 1,469 (4.8%) (1.7%)
DVR service ........................... 634 697 675 (9.0%) 3.3%
Franchise and other fees(b) ................. 464 484 505 (4.1%) (4.2%)
Total ................................. $ 10,002 $ 10,481 $ 10,917 (4.6%) (4.0%)
(a) Programming tier revenue includes subscriber fees for the Company’s various tiers or packages of video programming services generally
distinguished from one another by the number and type of programming networks they include.
(b) Franchise and other fees include fees collected on behalf of franchising authorities and the FCC.
The decrease in residential video revenue in 2014 was primarily due to a decline in video subscribers, partially offset
by an increase in average revenue per subscriber. The increase in average revenue per subscriber was primarily the result
of price increases and higher premium network revenue (which, for 2013, was reduced by approximately $15 million of
subscriber credits issued during the third quarter in connection with a temporary blackout of a premium network resulting
from a dispute with a programming vendor), partially offset by lower transactional video-on-demand revenue.
The decrease in residential video revenue in 2013 was primarily due to declines in video subscribers and premium
network revenue (which, for 2013, was reduced by approximately $15 million of subscriber credits discussed above) and
lower transactional video-on-demand revenue. These decreases were partially offset by price increases and a greater
percentage of subscribers purchasing higher-priced tiers of service, as well as two additional months of Insight revenue,
which totaled $93 million.
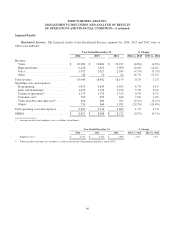
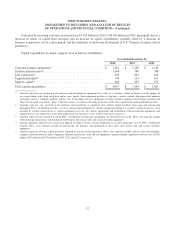
High-speed data. Residential high-speed data revenue increased in 2014 due to growth in average revenue per
subscriber and an increase in high-speed data subscribers. The increase in average revenue per subscriber was primarily
due to increases in prices and equipment rental charges and a greater percentage of subscribers purchasing higher-priced
tiers of service.
48