Time Warner Cable 2014 Annual Report Download - page 107
Download and view the complete annual report
Please find page 107 of the 2014 Time Warner Cable annual report below. You can navigate through the pages in the report by either clicking on the pages listed below, or by using the keyword search tool below to find specific information within the annual report.-
 1
1 -
2
-
3
-
4
-
5
-
6
-
7
-
8
-
9
-
10
-
11
-
12
-
13
-
14
-
15
-
16
-
17
-
18
-
19
-
20
-
21
-
22
-
23
-
24
-
25
-
26
-
27
-
28
-
29
-
30
-
31
-
32
-
33
-
34
-
35
-
36
-
37
-
38
-
39
-
40
-
41
-
42
-
43
-
44
-
45
-
46
-
47
-
48
-
49
-
50
-
51
-
52
-
53
-
54
-
55
-
56
-
57
-
58
-
59
-
60
-
61
-
62
-
63
-
64
-
65
-
66
-
67
-
68
-
69
-
70
-
71
-
72
-
73
-
74
-
75
-
76
-
77
-
78
-
79
-
80
-
81
-
82
-
83
-
84
-
85
-
86
-
87
-
88
-
89
-
90
-
91
-
92
-
93
-
94
-
95
-
96
-
 97
97 -
 98
98 -
 99
99 -
 100
100 -
 101
101 -
 102
102 -
 103
103 -
 104
104 -
 105
105 -
 106
106 -
 107
107 -
 108
108 -
 109
109 -
 110
110 -
 111
111 -
 112
112 -
 113
113 -
 114
114 -
 115
115 -
 116
116 -
 117
117 -
118
-
119
-
120
-
121
-
122
-
123
-
124
-
125
-
126
-
127
-
128
-
129
-
130
-
131
-
132
-
133
-
134
-
135
-
136
-
137
-
138
-
139
-
140
-
141
-
142
-
143
-
144
-
145
-
146
-
147
-
148
-
149
-
150
 |
 |

TIME WARNER CABLE INC.
NOTES TO CONSOLIDATED FINANCIAL STATEMENTS—(Continued)
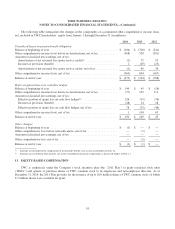
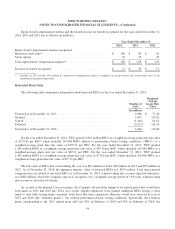
Weighted-average assumptions used to determine net periodic benefit cost for the years ended December 31, 2014,
2013 and 2012 consisted of the following:
2014 2013 2012
Expected long-term rate of return on plan assets ........................ 7.50% 7.50% 7.75%
Discount rate .................................................... 5.27% 4.31% 5.21%
Rate of compensation increase ...................................... 4.75% 4.75% 5.25%
The discount rates used to determine benefit obligations and net periodic benefit costs were determined by the
matching of plan liability cash flows to a portfolio of bonds individually selected from a large population of high-quality
corporate bonds.
In developing the expected long-term rate of return on plan assets, the Company considered the pension portfolio’s
composition, past average rate of earnings, discussions with portfolio managers and the Company’s asset allocation
targets. The weighted-average expected long-term rate of return on plan assets used to determine net periodic benefit cost
for the year ended December 31, 2015 is expected to be 7.50%.
Pension Assets
The assets of the qualified pension plans are held in a master trust in which the qualified pension plans are the only
participating plans (the “Master Trust”). The investment policy for the qualified pension plans is to maximize the long-
term rate of return on plan assets within a prudent level of risk and diversification while maintaining adequate funding
levels. The investment portfolio is a mix of equity and fixed-income securities with the objective of matching plan
liability performance, diversifying risk and achieving a target investment return. The pension plans’ Investment
Committee regularly monitors investment performance, investment allocation policies and the performance of individual
investment managers of the Master Trust and makes adjustments and changes when necessary. On a periodic basis, the
Investment Committee conducts a broad strategic review of its portfolio construction and investment allocation
policies. Neither the Company nor the Investment Committee manages any assets internally or directly utilizes derivative
instruments or hedging; however, the investment mandate of some investment managers allows the use of derivatives as
components of their standard portfolio management strategies. Pension assets are managed in a balanced portfolio
comprised of two major components: a return-seeking portion and a liability-matching portion. The expected role of
return-seeking investments is to maximize the long-term growth of pension assets with a prudent level of risk, while the
role of liability-matching investments is to provide a partial hedge against liability performance associated with changes
in interest rates and potentially provide some protection against a prolonged decline in the market value of equity
investments. The objective within return-seeking investments is to achieve asset diversity in order to balance return and
volatility.
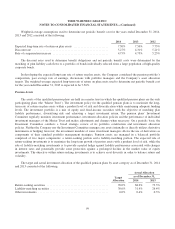
The target and actual investment allocation of the qualified pension plans by asset category as of December 31, 2014
and 2013 consisted of the following:
Actual Allocation
Target
Allocation
as of December 31,
2014 2013
Return-seeking securities .......................................... 70.0% 68.2% 73.3%
Liability-matching securities ........................................ 30.0% 31.4% 26.4%
Other investments ................................................ 0.0% 0.4% 0.3%
99