Time Warner Cable 2014 Annual Report Download - page 130
Download and view the complete annual report
Please find page 130 of the 2014 Time Warner Cable annual report below. You can navigate through the pages in the report by either clicking on the pages listed below, or by using the keyword search tool below to find specific information within the annual report.-
 1
1 -
2
-
3
-
4
-
5
-
6
-
7
-
8
-
9
-
10
-
11
-
12
-
13
-
14
-
15
-
16
-
17
-
18
-
19
-
20
-
21
-
22
-
23
-
24
-
25
-
26
-
27
-
28
-
29
-
30
-
31
-
32
-
33
-
34
-
35
-
36
-
37
-
38
-
39
-
40
-
41
-
42
-
43
-
44
-
45
-
46
-
47
-
48
-
49
-
50
-
51
-
52
-
53
-
54
-
55
-
56
-
57
-
58
-
59
-
60
-
61
-
62
-
63
-
64
-
65
-
66
-
67
-
68
-
69
-
70
-
71
-
72
-
73
-
74
-
75
-
76
-
77
-
78
-
79
-
80
-
81
-
82
-
83
-
84
-
85
-
86
-
87
-
88
-
89
-
90
-
91
-
92
-
93
-
94
-
95
-
96
-
97
-
98
-
99
-
100
-
101
-
102
-
103
-
104
-
105
-
106
-
107
-
108
-
109
-
110
-
111
-
112
-
113
-
114
-
115
-
116
-
117
-
118
-
119
-
 120
120 -
 121
121 -
 122
122 -
 123
123 -
 124
124 -
 125
125 -
 126
126 -
 127
127 -
 128
128 -
 129
129 -
 130
130 -
 131
131 -
 132
132 -
 133
133 -
 134
134 -
 135
135 -
 136
136 -
 137
137 -
 138
138 -
 139
139 -
 140
140 -
141
-
142
-
143
-
144
-
145
-
146
-
147
-
148
-
149
-
150
 |
 |

TIME WARNER CABLE INC.
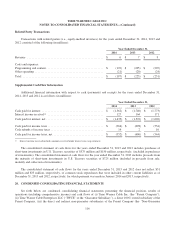
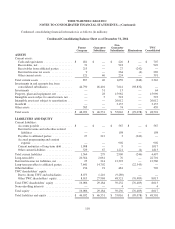
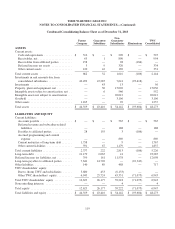
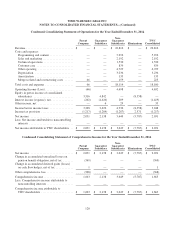
NOTES TO CONSOLIDATED FINANCIAL STATEMENTS—(Continued)
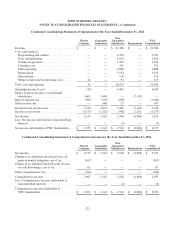
Condensed Consolidating Statement of Operations for the Year Ended December 31, 2012
Parent
Company
Guarantor
Subsidiary
Non-
Guarantor
Subsidiaries Eliminations
TWC
Consolidated
Revenue ................................ $ — $ — $ 21,386 $ — $ 21,386
Costs and expenses:
Programming and content ................ — — 4,703 — 4,703
Sales and marketing ..................... — — 1,816 — 1,816
Technical operations ..................... — — 1,434 — 1,434
Customer care .......................... — — 741 — 741
Other operating ......................... — — 4,868 — 4,868
Depreciation ........................... — — 3,154 — 3,154
Amortization ........................... — — 110 — 110
Merger-related and restructuring costs ....... 24 — 91 — 115
Total costs and expenses ................... 24 — 16,917 — 16,941
Operating Income (Loss) ................... (24) — 4,469 — 4,445
Equity in pretax income of consolidated
subsidiaries ............................ 3,663 3,484 — (7,147) —
Interest expense, net ....................... (309) (307) (990) — (1,606)
Other income, net ......................... — 480 17 — 497
Income before income taxes ................. 3,330 3,657 3,496 (7,147) 3,336
Income tax provision ...................... (1,175) (1,315) (948) 2,261 (1,177)
Net income .............................. 2,155 2,342 2,548 (4,886) 2,159
Less: Net income attributable to noncontrolling
interests ............................... — — (4) — (4)
Net income attributable to TWC shareholders . . . $ 2,155 $ 2,342 $ 2,544 $ (4,886) $ 2,155
Condensed Consolidating Statement of Comprehensive Income for the Year Ended December 31, 2012
Parent
Company
Guarantor
Subsidiary
Non-
Guarantor
Subsidiaries Eliminations
TWC
Consolidated
Net income .............................. $ 2,155 $ 2,342 $ 2,548 $ (4,886) $ 2,159
Change in accumulated unrealized losses on
pension benefit obligation, net of tax ........ (167) — — — (167)
Change in accumulated deferred gains (losses)
on cash flow hedges, net of tax ............ 63 — — — 63
Other comprehensive loss .................. (104) — — — (104)
Comprehensive income .................... 2,051 2,342 2,548 (4,886) 2,055
Less: Comprehensive income attributable to
noncontrolling interests .................. — — (4) — (4)
Comprehensive income attributable to
TWC shareholders ...................... $ 2,051 $ 2,342 $ 2,544 $ (4,886) $ 2,051
122