Time Warner Cable 2014 Annual Report Download - page 51
Download and view the complete annual report
Please find page 51 of the 2014 Time Warner Cable annual report below. You can navigate through the pages in the report by either clicking on the pages listed below, or by using the keyword search tool below to find specific information within the annual report.-
 1
1 -
2
-
3
-
4
-
5
-
6
-
7
-
8
-
9
-
10
-
11
-
12
-
13
-
14
-
15
-
16
-
17
-
18
-
19
-
20
-
21
-
22
-
23
-
24
-
25
-
26
-
27
-
28
-
29
-
30
-
31
-
32
-
33
-
34
-
35
-
36
-
37
-
38
-
39
-
40
-
 41
41 -
 42
42 -
 43
43 -
 44
44 -
 45
45 -
 46
46 -
 47
47 -
 48
48 -
 49
49 -
 50
50 -
 51
51 -
 52
52 -
 53
53 -
 54
54 -
 55
55 -
 56
56 -
 57
57 -
 58
58 -
 59
59 -
 60
60 -
 61
61 -
62
-
63
-
64
-
65
-
66
-
67
-
68
-
69
-
70
-
71
-
72
-
73
-
74
-
75
-
76
-
77
-
78
-
79
-
80
-
81
-
82
-
83
-
84
-
85
-
86
-
87
-
88
-
89
-
90
-
91
-
92
-
93
-
94
-
95
-
96
-
97
-
98
-
99
-
100
-
101
-
102
-
103
-
104
-
105
-
106
-
107
-
108
-
109
-
110
-
111
-
112
-
113
-
114
-
115
-
116
-
117
-
118
-
119
-
120
-
121
-
122
-
123
-
124
-
125
-
126
-
127
-
128
-
129
-
130
-
131
-
132
-
133
-
134
-
135
-
136
-
137
-
138
-
139
-
140
-
141
-
142
-
143
-
144
-
145
-
146
-
147
-
148
-
149
-
150
 |
 |
TIME WARNER CABLE INC.
MANAGEMENT’S DISCUSSION AND ANALYSIS OF RESULTS
OF OPERATIONS AND FINANCIAL CONDITION—(Continued)
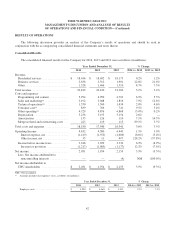
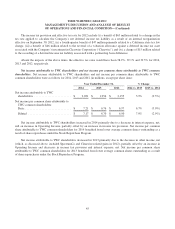
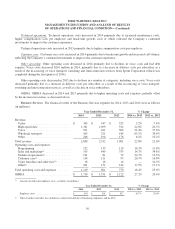
Revenue. The increases in revenue for 2014 and 2013 were due to increases in revenue at all segments.
Revenue in 2014 includes $116 million of revenue from DukeNet, which was acquired on December 31, 2013.
Compared to 2012, revenue in 2013 includes $183 million (primarily related to the Residential Services segment) as a
result of two additional months of revenue from Insight Communications Company, Inc. (“Insight”), which was acquired
on February 29, 2012.
Revenue by segment, including the amounts attributable to acquisitions, is discussed in greater detail below in
“Segment Results.”
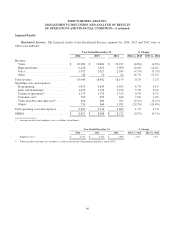
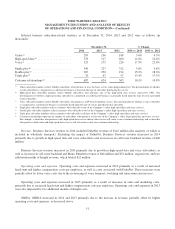
Costs and expenses
Operating costs and expenses. The increase in operating costs and expenses in 2014 was primarily due to increases
in the following: programming costs at the Residential Services segment; content costs at the Other Operations segment;
sales and marketing costs at the Residential Services and Business Services segments; customer care costs at the
Residential Services segment; and costs associated with advertising inventory sold on behalf of other video distributors
(“ad rep agreements”) at the Other Operations segment; partially offset by a decrease in voice costs at the Residential and
Business Services segment. For 2014, the growth in operating costs and expenses was reduced by a $124 million decrease
in pension expense.
The increase in operating costs and expenses in 2013 was primarily due to increases in the following: programming
costs at the Residential Services segment; content costs at the Other Operations segment; sales and marketing costs at the
Residential Services and Business Services segments; technical operations costs at the Residential Services segment; costs
associated with ad rep agreements at the Other Operations segment; and costs associated with the Company’s shared
functions; partially offset by a decrease in other operating costs at the Residential Services segment, primarily as a result
of lower voice costs.
Operating costs and expenses by segment are discussed in greater detail below in “Segment Results.”
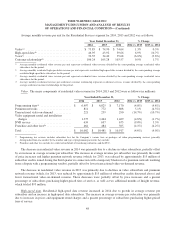
Depreciation. The increase in depreciation in 2014 was primarily due to growth in shorter-lived capitalized software
assets and an increase associated with certain DukeNet assets (acquired on December 31, 2013), partially offset by a
decrease associated with certain Insight assets that were fully depreciated as of August 2013.
Depreciation in 2013 was impacted by an increase in shorter-lived distribution system and capitalized software assets
as well as two additional months of Insight costs associated with its property, plant and equipment. These increases were
offset by a benefit of $160 million associated with (i) certain assets acquired in the July 31, 2006 transactions with
Adelphia Communications Corporation and Comcast that were fully depreciated as of July 2012 and (ii) certain Insight
assets that were fully depreciated as of August 2013.
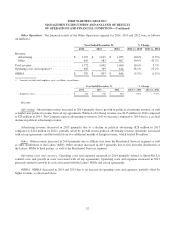
Amortization. Amortization increased in 2014 primarily as a result of DukeNet costs associated with its customer
relationship intangible assets.
Amortization increased in 2013 primarily as a result of two additional months of Insight costs associated with its
customer relationship intangible assets.
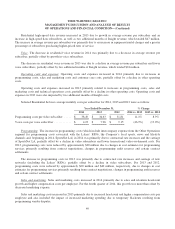
Merger-related and restructuring costs. During 2014, the Company incurred merger-related costs of $198 million,
which primarily consisted of Comcast merger-related costs, including employee retention costs of $121 million and
advisory and legal fees of $74 million. Merger-related costs in 2014 also included $3 million of costs incurred in
43