Time Warner Cable 2014 Annual Report Download - page 59
Download and view the complete annual report
Please find page 59 of the 2014 Time Warner Cable annual report below. You can navigate through the pages in the report by either clicking on the pages listed below, or by using the keyword search tool below to find specific information within the annual report.-
 1
1 -
2
-
3
-
4
-
5
-
6
-
7
-
8
-
9
-
10
-
11
-
12
-
13
-
14
-
15
-
16
-
17
-
18
-
19
-
20
-
21
-
22
-
23
-
24
-
25
-
26
-
27
-
28
-
29
-
30
-
31
-
32
-
33
-
34
-
35
-
36
-
37
-
38
-
39
-
40
-
41
-
42
-
43
-
44
-
45
-
46
-
47
-
48
-
 49
49 -
 50
50 -
 51
51 -
 52
52 -
 53
53 -
 54
54 -
 55
55 -
 56
56 -
 57
57 -
 58
58 -
 59
59 -
 60
60 -
 61
61 -
 62
62 -
 63
63 -
 64
64 -
 65
65 -
 66
66 -
 67
67 -
 68
68 -
 69
69 -
70
-
71
-
72
-
73
-
74
-
75
-
76
-
77
-
78
-
79
-
80
-
81
-
82
-
83
-
84
-
85
-
86
-
87
-
88
-
89
-
90
-
91
-
92
-
93
-
94
-
95
-
96
-
97
-
98
-
99
-
100
-
101
-
102
-
103
-
104
-
105
-
106
-
107
-
108
-
109
-
110
-
111
-
112
-
113
-
114
-
115
-
116
-
117
-
118
-
119
-
120
-
121
-
122
-
123
-
124
-
125
-
126
-
127
-
128
-
129
-
130
-
131
-
132
-
133
-
134
-
135
-
136
-
137
-
138
-
139
-
140
-
141
-
142
-
143
-
144
-
145
-
146
-
147
-
148
-
149
-
150
 |
 |

TIME WARNER CABLE INC.
MANAGEMENT’S DISCUSSION AND ANALYSIS OF RESULTS
OF OPERATIONS AND FINANCIAL CONDITION—(Continued)
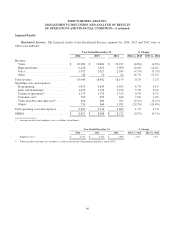
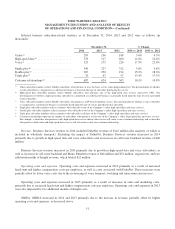
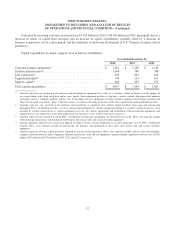
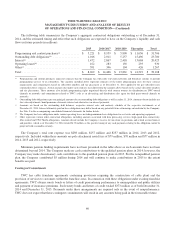
Selected business subscriber-related statistics as of December 31, 2014, 2013 and 2012 were as follows (in
thousands):
December 31, % Change
2014 2013 2012 2014 vs. 2013 2013 vs. 2012
Video(a) ............................... 203 196 188 3.6% 4.3%
High-speed data(b) ....................... 578 517 460 11.8% 12.4%
Voice(c) ............................... 323 275 224 17.5% 22.8%
Single play(d) ........................... 346 327 312 5.8% 4.8%
Double play(e) .......................... 265 230 194 15.2% 18.6%
Triple play(f) ........................... 76 67 57 13.4% 17.5%
Customer relationships(g) .................. 687 624 563 10.1% 10.8%
(a) Video subscriber numbers reflect billable subscribers who purchase at least the basic service video programming tier. The determination of whether
a video subscriber is categorized as residential or business is based on the type of subscriber purchasing the service.
(b) High-speed data subscriber numbers reflect billable subscribers who purchase any of the high-speed data services offered by TWC. The
determination of whether a high-speed data subscriber is categorized as residential or business is generally based upon the type of service provided
to that subscriber.
(c) Voice subscriber numbers reflect billable subscribers who purchase an IP-based telephony service. The determination of whether a voice subscriber
is categorized as residential or business is generally based upon the type of service provided to that subscriber.
(d) Single play subscriber numbers reflect customers who subscribe to one of the Company’s video, high-speed data and voice services.
(e) Double play subscriber numbers reflect customers who subscribe to two of the Company’s video, high-speed data and voice services.
(f) Triple play subscriber numbers reflect customers who subscribe to all three of the Company’s video, high-speed data and voice services.
(g) Customer relationships represent the number of subscribers who purchase at least one of the Company’s video, high-speed data and voice services.
For example, a subscriber who purchases only high-speed data service and no video service will count as one customer relationship, and a subscriber
who purchases both video and high-speed data services will also count as only one customer relationship.
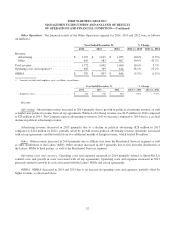
Revenue. Business Services revenue in 2014 included DukeNet revenue of $116 million (the majority of which is
included in wholesale transport). Excluding the impact of DukeNet, Business Services revenue increased in 2014
primarily due to growth in high-speed data and voice subscribers and an increase in cell tower backhaul revenue of $40
million.
Business Services revenue increased in 2013 primarily due to growth in high-speed data and voice subscribers, as
well as increases in cell tower backhaul and Metro Ethernet revenue of $44 million and $32 million, respectively, and two
additional months of Insight revenue, which totaled $12 million.
Operating costs and expenses. Operating costs and expenses increased in 2014 primarily as a result of increased
headcount and higher compensation costs per employee, as well as costs associated with DukeNet. These increases were
partially offset by lower voice costs due to the in-sourcing of voice transport, switching and interconnection services.
Operating costs and expenses increased in 2013 primarily as a result of increases in sales and marketing costs,
primarily due to increased headcount and higher compensation costs per employee. Operating costs and expenses in 2013
were also impacted by two additional months of Insight costs.
OIBDA. OIBDA increased in 2014 and 2013 primarily due to the increase in revenue, partially offset by higher
operating costs and expenses, as discussed above.
51