Time Warner Cable 2014 Annual Report Download - page 117
Download and view the complete annual report
Please find page 117 of the 2014 Time Warner Cable annual report below. You can navigate through the pages in the report by either clicking on the pages listed below, or by using the keyword search tool below to find specific information within the annual report.-
 1
1 -
2
-
3
-
4
-
5
-
6
-
7
-
8
-
9
-
10
-
11
-
12
-
13
-
14
-
15
-
16
-
17
-
18
-
19
-
20
-
21
-
22
-
23
-
24
-
25
-
26
-
27
-
28
-
29
-
30
-
31
-
32
-
33
-
34
-
35
-
36
-
37
-
38
-
39
-
40
-
41
-
42
-
43
-
44
-
45
-
46
-
47
-
48
-
49
-
50
-
51
-
52
-
53
-
54
-
55
-
56
-
57
-
58
-
59
-
60
-
61
-
62
-
63
-
64
-
65
-
66
-
67
-
68
-
69
-
70
-
71
-
72
-
73
-
74
-
75
-
76
-
77
-
78
-
79
-
80
-
81
-
82
-
83
-
84
-
85
-
86
-
87
-
88
-
89
-
90
-
91
-
92
-
93
-
94
-
95
-
96
-
97
-
98
-
99
-
100
-
101
-
102
-
103
-
104
-
105
-
106
-
 107
107 -
 108
108 -
 109
109 -
 110
110 -
 111
111 -
 112
112 -
 113
113 -
 114
114 -
 115
115 -
 116
116 -
 117
117 -
 118
118 -
 119
119 -
 120
120 -
 121
121 -
 122
122 -
 123
123 -
 124
124 -
 125
125 -
 126
126 -
 127
127 -
128
-
129
-
130
-
131
-
132
-
133
-
134
-
135
-
136
-
137
-
138
-
139
-
140
-
141
-
142
-
143
-
144
-
145
-
146
-
147
-
148
-
149
-
150
 |
 |

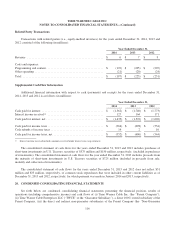
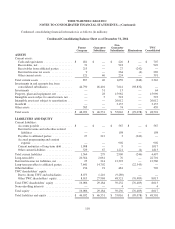
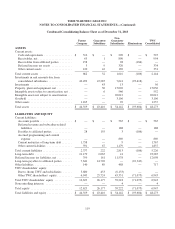
TIME WARNER CABLE INC.
NOTES TO CONSOLIDATED FINANCIAL STATEMENTS—(Continued)
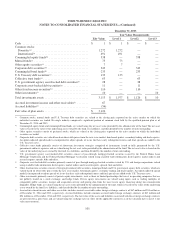
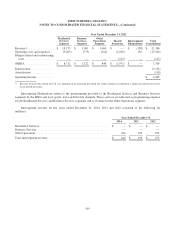
Year Ended December 31, 2012
Residential
Services
Segment
Business
Services
Segment
Other
Operations
Segment
Shared
Functions
Intersegment
Eliminations
Total
Consolidated
Revenue(a) ................. $ 18,175 $ 1,901 $ 1,460 $ — $ (150) $ 21,386
Operating costs and expenses . . (9,463) (779) (614) (2,856) 150 (13,562)
Merger-related and restructuring
costs .................... — — — (115) — (115)
OIBDA ................... $ 8,712 $ 1,122 $ 846 $ (2,971) $ — 7,709
Depreciation ............... (3,154)
Amortization ............... (110)
Operating Income ........... $ 4,445
(a) Revenue derived from outside the U.S. was insignificant in all periods presented. No single customer accounted for a significant amount of revenue
in any period presented.
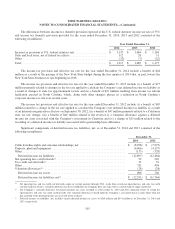
Intersegment Eliminations relates to the programming provided to the Residential Services and Business Services
segments by the RSNs and local sports, news and lifestyle channels. These services are reflected as programming expense
for the Residential Services and Business Services segments and as revenue for the Other Operations segment.
Intersegment revenue for the years ended December 31, 2014, 2013 and 2012 consisted of the following (in
millions):
Year Ended December 31,
2014 2013 2012
Residential Services ............................................... $ — $ — $ —
Business Services ................................................. — — —
Other Operations .................................................. 244 196 150
Total intersegment revenue ......................................... $ 244 $ 196 $ 150
109