Time Warner Cable 2014 Annual Report Download - page 60
Download and view the complete annual report
Please find page 60 of the 2014 Time Warner Cable annual report below. You can navigate through the pages in the report by either clicking on the pages listed below, or by using the keyword search tool below to find specific information within the annual report.-
 1
1 -
2
-
3
-
4
-
5
-
6
-
7
-
8
-
9
-
10
-
11
-
12
-
13
-
14
-
15
-
16
-
17
-
18
-
19
-
20
-
21
-
22
-
23
-
24
-
25
-
26
-
27
-
28
-
29
-
30
-
31
-
32
-
33
-
34
-
35
-
36
-
37
-
38
-
39
-
40
-
41
-
42
-
43
-
44
-
45
-
46
-
47
-
48
-
49
-
 50
50 -
 51
51 -
 52
52 -
 53
53 -
 54
54 -
 55
55 -
 56
56 -
 57
57 -
 58
58 -
 59
59 -
 60
60 -
 61
61 -
 62
62 -
 63
63 -
 64
64 -
 65
65 -
 66
66 -
 67
67 -
 68
68 -
 69
69 -
 70
70 -
71
-
72
-
73
-
74
-
75
-
76
-
77
-
78
-
79
-
80
-
81
-
82
-
83
-
84
-
85
-
86
-
87
-
88
-
89
-
90
-
91
-
92
-
93
-
94
-
95
-
96
-
97
-
98
-
99
-
100
-
101
-
102
-
103
-
104
-
105
-
106
-
107
-
108
-
109
-
110
-
111
-
112
-
113
-
114
-
115
-
116
-
117
-
118
-
119
-
120
-
121
-
122
-
123
-
124
-
125
-
126
-
127
-
128
-
129
-
130
-
131
-
132
-
133
-
134
-
135
-
136
-
137
-
138
-
139
-
140
-
141
-
142
-
143
-
144
-
145
-
146
-
147
-
148
-
149
-
150
 |
 |

TIME WARNER CABLE INC.
MANAGEMENT’S DISCUSSION AND ANALYSIS OF RESULTS
OF OPERATIONS AND FINANCIAL CONDITION—(Continued)
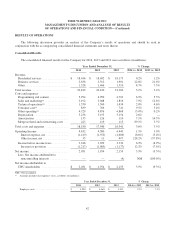
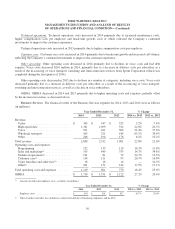
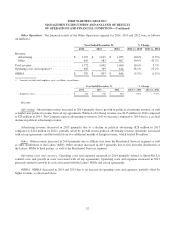
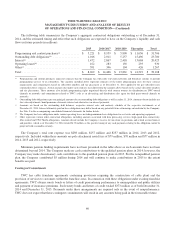
Other Operations. The financial results of the Other Operations segment for 2014, 2013 and 2012 were as follows
(in millions):
Year Ended December 31, % Change
2014 2013 2012 2014 vs. 2013 2013 vs. 2012
Revenue:
Advertising .......................... $ 1,127 $ 1,019 $ 1,053 10.6% (3.2%)
Other ............................... 645 583 407 10.6% 43.2%
Total revenue ........................... 1,772 1,602 1,460 10.6% 9.7%
Operating costs and expenses(a) ............. 985 769 614 28.1% 25.2%
OIBDA ............................... $ 787 $ 833 $ 846 (5.5%) (1.5%)
(a) Amounts include total employee costs, as follows (in millions):
Year Ended December 31, % Change
2014 2013 2012 2014 vs. 2013 2013 vs. 2012
Employee costs ............................... $ 322 $ 320 $ 304 0.6% 5.3%
Revenue
Advertising. Advertising revenue increased in 2014 primarily due to growth in political advertising revenue, as well
as higher non-political revenue from ad rep agreements. Political advertising revenue was $113 million in 2014 compared
to $28 million in 2013. The Company expects advertising revenue in 2015 to decrease compared to 2014 due to a cyclical
decline in political advertising revenue.
Advertising revenue decreased in 2013 primarily due to a decline in political advertising ($28 million in 2013
compared to $114 million in 2012), partially offset by growth in non-political advertising revenue (primarily associated
with ad rep agreements) and the benefit from two additional months of Insight revenue, which totaled $6 million.
Other. Other revenue increased in 2014 primarily due to affiliate fees from the Residential Services segment as well
as other distributors of the Lakers’ RSNs. Other revenue increased in 2013 primarily due to fees from the distribution of
the Lakers’ RSNs to third parties, as well as the Residential Services segment.
Operating costs and expenses. Operating costs and expenses increased in 2014 primarily related to SportsNet LA
content costs and growth in costs associated with ad rep agreements. Operating costs and expenses increased in 2013
primarily related to growth in costs associated with the Lakers’ RSNs and ad rep agreements.
OIBDA. OIBDA decreased in 2014 and 2013 due to an increase in operating costs and expenses, partially offset by
higher revenue, as discussed above.
52