Time Warner Cable 2014 Annual Report Download - page 63
Download and view the complete annual report
Please find page 63 of the 2014 Time Warner Cable annual report below. You can navigate through the pages in the report by either clicking on the pages listed below, or by using the keyword search tool below to find specific information within the annual report.-
 1
1 -
2
-
3
-
4
-
5
-
6
-
7
-
8
-
9
-
10
-
11
-
12
-
13
-
14
-
15
-
16
-
17
-
18
-
19
-
20
-
21
-
22
-
23
-
24
-
25
-
26
-
27
-
28
-
29
-
30
-
31
-
32
-
33
-
34
-
35
-
36
-
37
-
38
-
39
-
40
-
41
-
42
-
43
-
44
-
45
-
46
-
47
-
48
-
49
-
50
-
51
-
52
-
 53
53 -
 54
54 -
 55
55 -
 56
56 -
 57
57 -
 58
58 -
 59
59 -
 60
60 -
 61
61 -
 62
62 -
 63
63 -
 64
64 -
 65
65 -
 66
66 -
 67
67 -
 68
68 -
 69
69 -
 70
70 -
 71
71 -
 72
72 -
 73
73 -
74
-
75
-
76
-
77
-
78
-
79
-
80
-
81
-
82
-
83
-
84
-
85
-
86
-
87
-
88
-
89
-
90
-
91
-
92
-
93
-
94
-
95
-
96
-
97
-
98
-
99
-
100
-
101
-
102
-
103
-
104
-
105
-
106
-
107
-
108
-
109
-
110
-
111
-
112
-
113
-
114
-
115
-
116
-
117
-
118
-
119
-
120
-
121
-
122
-
123
-
124
-
125
-
126
-
127
-
128
-
129
-
130
-
131
-
132
-
133
-
134
-
135
-
136
-
137
-
138
-
139
-
140
-
141
-
142
-
143
-
144
-
145
-
146
-
147
-
148
-
149
-
150
 |
 |

TIME WARNER CABLE INC.
MANAGEMENT’S DISCUSSION AND ANALYSIS OF RESULTS
OF OPERATIONS AND FINANCIAL CONDITION—(Continued)
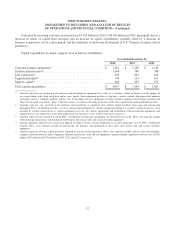
Operating Activities
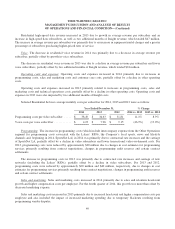
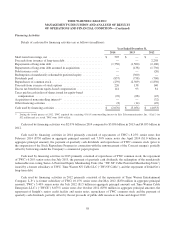
Details of cash provided by operating activities are as follows (in millions):
Year Ended December 31,
2014 2013 2012
Operating Income ............................................... $ 4,632 $ 4,580 $ 4,445
Depreciation ................................................... 3,236 3,155 3,154
Amortization ................................................... 135 126 110
Noncash equity-based compensation ................................ 182 128 130
Cash paid for interest, net(a) ....................................... (1,435) (1,576) (1,602)
Cash paid for income taxes, net(b) ................................... (352) (696) (544)
Pension plan contributions ........................................ (5) (6) (289)
All other, net, including working capital changes ...................... (43) 42 121
Cash provided by operating activities ............................... $ 6,350 $ 5,753 $ 5,525
(a) Amounts include interest income received (including amounts received under interest rate swap contracts) of $127 million, $164 million and $171
million in 2014, 2013 and 2012, respectively.
(b) Amounts include cash refunds of income taxes of $14 million, $2 million and $10 million in 2014, 2013 and 2012, respectively.
Cash provided by operating activities increased from $5.753 billion in 2013 to $6.350 billion in 2014. This increase
was primarily related to a decrease in cash paid for income taxes, net, growth in Operating Income (excluding
depreciation and amortization) and a decrease in cash paid for interest, net.
Cash paid for income taxes, net, decreased during 2014 primarily as a result of certain capital expenditure-related
deductions, including the tangible repair regulations (e.g., de minimus expensing) released in late 2013, which were
partially offset by the continued reversal of bonus depreciation benefits recorded in prior years. On December 19, 2014,
the Tax Increase Prevention Act of 2014 was enacted, extending bonus depreciation deductions of 50% of the cost of the
Company’s qualified 2014 capital expenditures. The Company expects cash paid for income taxes, net, to increase in 2015
primarily as a result of the reversal of prior year bonus depreciation benefits, partially offset by benefits relating to the late
enactment of 50% bonus depreciation in December of 2014.
Cash paid for interest, net, decreased during 2014 primarily as a result of the maturity of TWC’s 6.20% senior notes
due July 2013 ($1.5 billion in aggregate principal amount), 8.25% senior notes due February 2014 ($750 million in
aggregate principal amount) and 7.50% senior notes due April 2014 ($1.0 billion in aggregate principal amount).
The Company made no cash contributions to its qualified defined benefit pension plans (the “qualified pension
plans”) and contributed $5 million to its nonqualified defined benefit pension plan (the “nonqualified pension plan” and,
together with the qualified pension plans, the “pension plans”) during 2014. As of December 31, 2014, the pension plans
were underfunded by $100 million. The Company may make discretionary cash contributions to the qualified pension
plans in 2015. Such contributions will be dependent on a variety of factors, including current and expected interest rates,
asset performance, the funded status of the qualified pension plans and management’s judgment. For the nonqualified
pension plan, the Company will continue to make contributions in 2015 to the extent benefits are paid. See Note 14 to the
accompanying consolidated financial statements for additional discussion of the pension plans.
Cash provided by operating activities increased from $5.525 billion in 2012 to $5.753 billion in 2013. This increase
was primarily related to an increase in Operating Income and decreases in pension plan contributions and cash paid for
interest, net, partially offset by an increase in cash paid for income taxes, net, and a change in working capital
55