Time Warner Cable 2014 Annual Report Download - page 61
Download and view the complete annual report
Please find page 61 of the 2014 Time Warner Cable annual report below. You can navigate through the pages in the report by either clicking on the pages listed below, or by using the keyword search tool below to find specific information within the annual report.-
 1
1 -
2
-
3
-
4
-
5
-
6
-
7
-
8
-
9
-
10
-
11
-
12
-
13
-
14
-
15
-
16
-
17
-
18
-
19
-
20
-
21
-
22
-
23
-
24
-
25
-
26
-
27
-
28
-
29
-
30
-
31
-
32
-
33
-
34
-
35
-
36
-
37
-
38
-
39
-
40
-
41
-
42
-
43
-
44
-
45
-
46
-
47
-
48
-
49
-
50
-
 51
51 -
 52
52 -
 53
53 -
 54
54 -
 55
55 -
 56
56 -
 57
57 -
 58
58 -
 59
59 -
 60
60 -
 61
61 -
 62
62 -
 63
63 -
 64
64 -
 65
65 -
 66
66 -
 67
67 -
 68
68 -
 69
69 -
 70
70 -
 71
71 -
72
-
73
-
74
-
75
-
76
-
77
-
78
-
79
-
80
-
81
-
82
-
83
-
84
-
85
-
86
-
87
-
88
-
89
-
90
-
91
-
92
-
93
-
94
-
95
-
96
-
97
-
98
-
99
-
100
-
101
-
102
-
103
-
104
-
105
-
106
-
107
-
108
-
109
-
110
-
111
-
112
-
113
-
114
-
115
-
116
-
117
-
118
-
119
-
120
-
121
-
122
-
123
-
124
-
125
-
126
-
127
-
128
-
129
-
130
-
131
-
132
-
133
-
134
-
135
-
136
-
137
-
138
-
139
-
140
-
141
-
142
-
143
-
144
-
145
-
146
-
147
-
148
-
149
-
150
 |
 |

TIME WARNER CABLE INC.
MANAGEMENT’S DISCUSSION AND ANALYSIS OF RESULTS
OF OPERATIONS AND FINANCIAL CONDITION—(Continued)
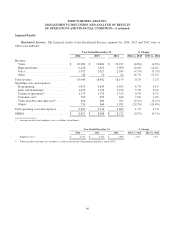
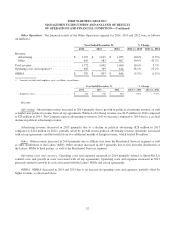
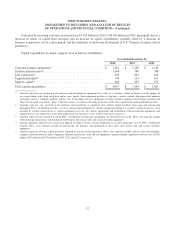
Shared Functions. Costs and expenses associated with the Company’s shared functions, which consist of operating
costs associated with broad “corporate” functions (e.g., accounting and finance, information technology, executive
management, legal and human resources) or functions supporting more than one reportable segment that are centrally
managed (e.g., facilities, network operations, vehicles and procurement) as well as other activities not directly attributable
to a reportable segment, for 2014, 2013 and 2012 were as follows (in millions):
Year Ended December 31, % Change
2014 2013 2012 2014 vs. 2013 2013 vs. 2012
Operating costs and expenses(a) ............. $ 2,901 $ 2,892 $ 2,856 0.3% 1.3%
Merger-related and restructuring costs ....... 225 119 115 89.1% 3.5%
Total costs and expenses .................. $ 3,126 $ 3,011 $ 2,971 3.8% 1.3%
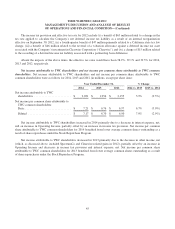
(a) Amounts include total employee costs, as follows (in millions):
Year Ended December 31, % Change
2014 2013 2012 2014 vs. 2013 2013 vs. 2012
Employee costs ............................... $ 1,282 $ 1,356 $ 1,302 (5.5%) 4.1%
Operating costs and expenses. Operating costs and expenses increased slightly in 2014 primarily due to increased
maintenance expense, partially offset by lower costs as a result of operating efficiencies, including decreased headcount.
Operating costs and expenses increased in 2013 primarily related to increases in facilities costs and network
operations employee costs, primarily due to increased headcount and higher compensation costs per employee, partially
offset by lower procurement-related consulting costs. Shared functions employee costs for 2013 also included $10 million
of executive severance costs.
Merger-related and restructuring costs. During 2014, the Company incurred merger-related costs of $198 million,
which primarily consisted of Comcast merger-related costs, including employee retention costs of $121 million and
advisory and legal fees of $74 million. Merger-related costs in 2014 also included $3 million of costs incurred in
connection with the DukeNet acquisition. During 2013, the Company incurred merger-related costs of $13 million in
connection with the Insight and DukeNet acquisitions. During 2012, the Company incurred merger-related costs of $54
million, primarily associated with the Insight acquisition. The Company expects to incur additional merger-related costs in
2015.
The Company incurred restructuring costs of $27 million during 2014 compared to $106 million in 2013 and $61
million in 2012. These restructuring costs were primarily related to employee terminations and other exit costs. The
Company expects to incur additional restructuring costs in 2015.
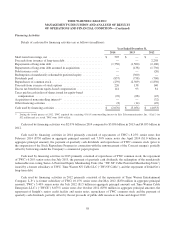
FINANCIAL CONDITION AND LIQUIDITY
Management believes that cash generated by or available to TWC should be sufficient to fund its capital and liquidity
needs for the next twelve months and for the foreseeable future thereafter, including quarterly dividend payments and
maturities of long-term debt. TWC’s sources of cash include cash and equivalents on hand, cash provided by operating
activities and borrowing capacity under the Company’s $3.5 billion senior unsecured five-year revolving credit facility
(the “Revolving Credit Facility”) and the Company’s $2.5 billion unsecured commercial paper program (which is
supported by unused committed capacity under the Revolving Credit Facility), as well as access to capital markets.
53