Time Warner Cable 2014 Annual Report Download - page 76
Download and view the complete annual report
Please find page 76 of the 2014 Time Warner Cable annual report below. You can navigate through the pages in the report by either clicking on the pages listed below, or by using the keyword search tool below to find specific information within the annual report.-
 1
1 -
2
-
3
-
4
-
5
-
6
-
7
-
8
-
9
-
10
-
11
-
12
-
13
-
14
-
15
-
16
-
17
-
18
-
19
-
20
-
21
-
22
-
23
-
24
-
25
-
26
-
27
-
28
-
29
-
30
-
31
-
32
-
33
-
34
-
35
-
36
-
37
-
38
-
39
-
40
-
41
-
42
-
43
-
44
-
45
-
46
-
47
-
48
-
49
-
50
-
51
-
52
-
53
-
54
-
55
-
56
-
57
-
58
-
59
-
60
-
61
-
62
-
63
-
64
-
65
-
 66
66 -
 67
67 -
 68
68 -
 69
69 -
 70
70 -
 71
71 -
 72
72 -
 73
73 -
 74
74 -
 75
75 -
 76
76 -
 77
77 -
 78
78 -
 79
79 -
 80
80 -
 81
81 -
 82
82 -
 83
83 -
 84
84 -
 85
85 -
 86
86 -
87
-
88
-
89
-
90
-
91
-
92
-
93
-
94
-
95
-
96
-
97
-
98
-
99
-
100
-
101
-
102
-
103
-
104
-
105
-
106
-
107
-
108
-
109
-
110
-
111
-
112
-
113
-
114
-
115
-
116
-
117
-
118
-
119
-
120
-
121
-
122
-
123
-
124
-
125
-
126
-
127
-
128
-
129
-
130
-
131
-
132
-
133
-
134
-
135
-
136
-
137
-
138
-
139
-
140
-
141
-
142
-
143
-
144
-
145
-
146
-
147
-
148
-
149
-
150
 |
 |

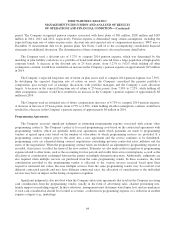
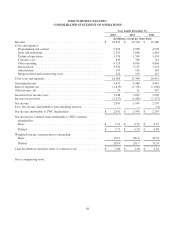
TIME WARNER CABLE INC.
CONSOLIDATED STATEMENT OF OPERATIONS
Year Ended December 31,
2014 2013 2012
(in millions, except per share data)
Revenue ................................................... $ 22,812 $ 22,120 $ 21,386
Costs and expenses:
Programming and content .................................... 5,294 4,950 4,703
Sales and marketing ........................................ 2,192 2,048 1,816
Technical operations ........................................ 1,530 1,500 1,434
Customer care ............................................. 839 766 741
Other operating ............................................ 4,729 4,876 4,868
Depreciation .............................................. 3,236 3,155 3,154
Amortization .............................................. 135 126 110
Merger-related and restructuring costs .......................... 225 119 115
Total costs and expenses ....................................... 18,180 17,540 16,941
Operating Income ............................................ 4,632 4,580 4,445
Interest expense, net .......................................... (1,419) (1,552) (1,606)
Other income, net ............................................ 35 11 497
Income before income taxes .................................... 3,248 3,039 3,336
Income tax provision ......................................... (1,217) (1,085) (1,177)
Net income ................................................. 2,031 1,954 2,159
Less: Net income attributable to noncontrolling interests ............. — — (4)
Net income attributable to TWC shareholders ...................... $ 2,031 $ 1,954 $ 2,155
Net income per common share attributable to TWC common
shareholders:
Basic .................................................... $ 7.21 $ 6.76 $ 6.97
Diluted .................................................. $ 7.17 $ 6.70 $ 6.90
Weighted-average common shares outstanding:
Basic .................................................... 279.3 287.6 307.8
Diluted .................................................. 283.0 291.7 312.4
Cash dividends declared per share of common stock ................. $ 3.00 $ 2.60 $ 2.24
See accompanying notes.
68