Time Warner Cable 2014 Annual Report Download - page 112
Download and view the complete annual report
Please find page 112 of the 2014 Time Warner Cable annual report below. You can navigate through the pages in the report by either clicking on the pages listed below, or by using the keyword search tool below to find specific information within the annual report.-
 1
1 -
2
-
3
-
4
-
5
-
6
-
7
-
8
-
9
-
10
-
11
-
12
-
13
-
14
-
15
-
16
-
17
-
18
-
19
-
20
-
21
-
22
-
23
-
24
-
25
-
26
-
27
-
28
-
29
-
30
-
31
-
32
-
33
-
34
-
35
-
36
-
37
-
38
-
39
-
40
-
41
-
42
-
43
-
44
-
45
-
46
-
47
-
48
-
49
-
50
-
51
-
52
-
53
-
54
-
55
-
56
-
57
-
58
-
59
-
60
-
61
-
62
-
63
-
64
-
65
-
66
-
67
-
68
-
69
-
70
-
71
-
72
-
73
-
74
-
75
-
76
-
77
-
78
-
79
-
80
-
81
-
82
-
83
-
84
-
85
-
86
-
87
-
88
-
89
-
90
-
91
-
92
-
93
-
94
-
95
-
96
-
97
-
98
-
99
-
100
-
101
-
 102
102 -
 103
103 -
 104
104 -
 105
105 -
 106
106 -
 107
107 -
 108
108 -
 109
109 -
 110
110 -
 111
111 -
 112
112 -
 113
113 -
 114
114 -
 115
115 -
 116
116 -
 117
117 -
 118
118 -
 119
119 -
 120
120 -
 121
121 -
 122
122 -
123
-
124
-
125
-
126
-
127
-
128
-
129
-
130
-
131
-
132
-
133
-
134
-
135
-
136
-
137
-
138
-
139
-
140
-
141
-
142
-
143
-
144
-
145
-
146
-
147
-
148
-
149
-
150
 |
 |

TIME WARNER CABLE INC.
NOTES TO CONSOLIDATED FINANCIAL STATEMENTS—(Continued)
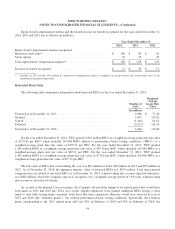
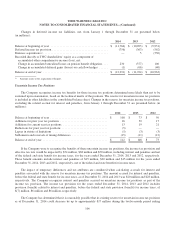
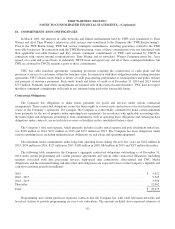
Restructuring Costs
The Company incurred restructuring costs of $27 million, $106 million and $61 million for the years ended
December 31, 2014, 2013 and 2012, respectively, primarily related to employee terminations and other exit costs. The
Company expects to incur additional restructuring costs in 2015. Changes in restructuring reserves from January 1
through December 31 are presented below (in millions):
Employee
Termination
Costs
Other
Exit
Costs Total
Remaining liability as of December 31, 2011 .......................... $ 29 $ 4 $ 33
Costs incurred .................................................. 46 15 61
Cash paid ...................................................... (51) (16) (67)
Remaining liability as of December 31, 2012 .......................... 24 3 27
Costs incurred .................................................. 88 18 106
Cash paid ...................................................... (73) (17) (90)
Remaining liability as of December 31, 2013 .......................... 39 4 43
Costs incurred .................................................. 14 16 30
Adjustments .................................................... (3) — (3)
Cash paid ...................................................... (42) (20) (62)
Remaining liability as of December 31, 2014(a) ........................ $ 8 $ — $ 8
(a) Of the remaining liability as of December 31, 2014, $6 million is classified as a current liability, with the remaining amount classified as a
noncurrent liability in the consolidated balance sheet. Amounts are expected to be paid through March 2018.
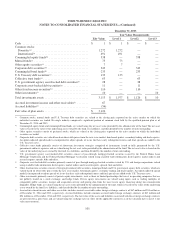
16. INCOME TAXES
The current and deferred income tax (benefit) provision for the years ended December 31, 2014, 2013 and 2012
consisted of the following (in millions):
Year Ended December 31,
2014 2013 2012
Federal:
Current ..................................................... $ 363 $ 631 $ 495
Deferred .................................................... 681 411 634
State:
Current ..................................................... 98 91 120
Deferred .................................................... 75 (48) (72)
Total ....................................................... $ 1,217 $ 1,085 $ 1,177
104