Time Warner Cable 2014 Annual Report Download - page 106
Download and view the complete annual report
Please find page 106 of the 2014 Time Warner Cable annual report below. You can navigate through the pages in the report by either clicking on the pages listed below, or by using the keyword search tool below to find specific information within the annual report.-
 1
1 -
2
-
3
-
4
-
5
-
6
-
7
-
8
-
9
-
10
-
11
-
12
-
13
-
14
-
15
-
16
-
17
-
18
-
19
-
20
-
21
-
22
-
23
-
24
-
25
-
26
-
27
-
28
-
29
-
30
-
31
-
32
-
33
-
34
-
35
-
36
-
37
-
38
-
39
-
40
-
41
-
42
-
43
-
44
-
45
-
46
-
47
-
48
-
49
-
50
-
51
-
52
-
53
-
54
-
55
-
56
-
57
-
58
-
59
-
60
-
61
-
62
-
63
-
64
-
65
-
66
-
67
-
68
-
69
-
70
-
71
-
72
-
73
-
74
-
75
-
76
-
77
-
78
-
79
-
80
-
81
-
82
-
83
-
84
-
85
-
86
-
87
-
88
-
89
-
90
-
91
-
92
-
93
-
94
-
95
-
 96
96 -
 97
97 -
 98
98 -
 99
99 -
 100
100 -
 101
101 -
 102
102 -
 103
103 -
 104
104 -
 105
105 -
 106
106 -
 107
107 -
 108
108 -
 109
109 -
 110
110 -
 111
111 -
 112
112 -
 113
113 -
 114
114 -
 115
115 -
 116
116 -
117
-
118
-
119
-
120
-
121
-
122
-
123
-
124
-
125
-
126
-
127
-
128
-
129
-
130
-
131
-
132
-
133
-
134
-
135
-
136
-
137
-
138
-
139
-
140
-
141
-
142
-
143
-
144
-
145
-
146
-
147
-
148
-
149
-
150
 |
 |

TIME WARNER CABLE INC.
NOTES TO CONSOLIDATED FINANCIAL STATEMENTS—(Continued)
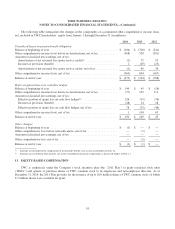
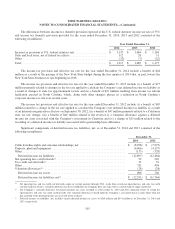
Pretax amounts recognized in the consolidated balance sheet as of December 31, 2014 and 2013 consisted of the
following (in millions):
December 31,
2014 2013
Noncurrent asset ............................................................. $ — $ 611
Current liability .............................................................. (5) (5)
Noncurrent liability ........................................................... (95) (32)
Total amounts recognized in assets and liabilities .................................... $ (100) $ 574
Accumulated other comprehensive income (loss), net:
Net actuarial loss ............................................................. $ (802) $ (211)
Prior service credit ............................................................ 30 37
Total amounts recognized in TWC shareholders’ equity .............................. $ (772) $ (174)
The components of net periodic benefit costs for the years ended December 31, 2014, 2013 and 2012 consisted of the
following (in millions):
Year Ended December 31,
2014 2013 2012
Service cost ...................................................... $ 173 $ 204 $ 169
Interest cost ...................................................... 144 139 131
Expected return on plan assets ....................................... (233) (214) (176)
Amounts amortized ................................................ (3) 75 59
Settlement loss ................................................... — 1 —
Net periodic benefit costs ........................................... $ 81 $ 205 $ 183
The estimated amounts that are expected to be amortized from accumulated other comprehensive income (loss), net,
into net periodic benefit costs in 2015 include actuarial losses net of prior service credits of $39 million.
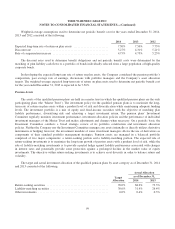
Weighted-average assumptions used to determine benefit obligations as of December 31, 2014, 2013 and 2012
consisted of the following:
2014 2013 2012
Discount rate ..................................................... 4.32% 5.27% 4.31%
Rate of compensation increase ....................................... 4.25% 4.75% 4.75%
In addition, the mortality tables used to determine benefit obligations as of December 31, 2014, 2013 and 2012
consisted of the following: RP 2000 healthy mortality table loaded 5.5% with generational improvements using Scale BB
for 2014 and the RP 2000 healthy mortality table projected to 2020 using Scale AA for 2013 and 2012.
98