Priceline 2010 Annual Report Download - page 57
Download and view the complete annual report
Please find page 57 of the 2010 Priceline annual report below. You can navigate through the pages in the report by either clicking on the pages listed below, or by using the keyword search tool below to find specific information within the annual report.-
 1
1 -
2
-
3
-
4
-
5
-
6
-
7
-
8
-
9
-
10
-
11
-
12
-
13
-
14
-
15
-
16
-
17
-
18
-
19
-
20
-
21
-
22
-
23
-
24
-
25
-
26
-
27
-
28
-
29
-
30
-
31
-
32
-
33
-
34
-
35
-
36
-
37
-
38
-
39
-
40
-
41
-
42
-
43
-
44
-
45
-
46
-
 47
47 -
 48
48 -
 49
49 -
 50
50 -
 51
51 -
 52
52 -
 53
53 -
 54
54 -
 55
55 -
 56
56 -
 57
57 -
 58
58 -
 59
59 -
 60
60 -
 61
61 -
 62
62 -
 63
63 -
 64
64 -
 65
65 -
 66
66 -
 67
67 -
68
-
69
-
70
-
71
-
72
-
73
-
74
-
75
-
76
-
77
-
78
-
79
-
80
-
81
-
82
-
83
-
84
-
85
-
86
-
87
-
88
-
89
-
90
-
91
-
92
-
93
-
94
-
95
-
96
-
97
-
98
-
99
-
100
-
101
-
102
-
103
-
104
-
105
-
106
-
107
-
108
-
109
-
110
-
111
-
112
-
113
-
114
-
115
-
116
-
117
-
118
-
119
-
120
-
121
-
122
-
123
-
124
-
125
-
126
-
127
-
128
-
129
-
130
-
131
-
132
-
133
-
134
-
135
-
136
-
137
-
138
-
139
-
140
-
141
-
142
-
143
-
144
-
145
-
146
-
147
-
148
-
149
-
150
-
151
-
152
-
153
-
154
-
155
-
156
-
157
-
158
-
159
-
160
-
161
-
162
-
163
-
164
-
165
-
166
-
167
-
168
-
169
-
170
-
171
-
172
-
173
-
174
-
175
-
176
-
177
-
178
-
179
-
180
-
181
-
182
-
183
-
184
-
185
-
186
-
187
-
188
-
189
-
190
-
191
-
192
-
193
-
194
-
195
-
196
-
197
-
198
-
199
-
200
 |
 |

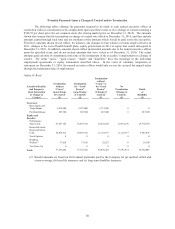
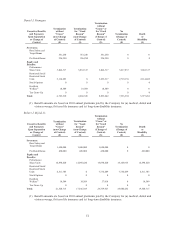
55
The following table shows compensation earned during 2010 by all non-employee directors serving at
any time during fiscal 2010.
Director Compensation
Name
Fees
Earned or
Paid in
Cash
($)(1)
Stock
Awards
($)(2)
Option
Awards
($)
All Other
Compensation
($)
Total
($)
Ralph M. Bahna
Chairman of the Board ..... 63,750 220,020
--
--
283,770
Howard W. Barker, Jr.
Director ............................ 71,250 109,892 -- -- 181,142
Jan L. Docter
Director ............................ 35,000 109,892 -- -- 144,892
Jeffrey E. Epstein
Director ............................ 57,500 109,892 -- -- 167,392
James M. Guyette
Director ............................ 53,750 109,892 -- -- 163,642
Nancy B. Peretsman
Director ............................ 35,000 109,892 -- -- 144,892
Craig W. Rydin
Director ............................ 62,500 109,892 -- -- 172,392
(1) This column reports the amount of cash compensation earned in 2010 for Board and committee service.
(2) This column represents the aggregate grant date fair value of RSUs computed in accordance with FASB ASC Topic
718. For additional information, please refer to Notes 2 and 3 of the Company’s Consolidated Financial Statements
for the year ended December 31, 2010, included in the Company’s Annual Report on Form 10-K. These amounts
reflect the Company’s accounting expense for these awards, and do not correspond to the actual value, if any, that
will be recognized by the non-employee directors. As of December 31, 2010, the following directors held the
following aggregate number of shares of restricted stock/restricted stock units (RSU), respectively: Bahna (1,000
restricted stock/3,792 RSU), Barker (500 restricted stock/2,659 RSU), Docter (1,464 RSU), Epstein (500 restricted
stock/2,659 RSU), Guyette (500 restricted stock/1,896 RSU), Peretsman (500 restricted stock/2,327 RSU) and
Rydin (500 restricted stock/2,659 RSU). In addition, Mr. Docter held 5,000 performance share units, for which the
estimated probable number of shares to be issued at the end of the performance period was 15,000 as of the end of
2010; the PSUs held by Mr. Docter vested in March 2011.