Priceline 2010 Annual Report Download - page 167
Download and view the complete annual report
Please find page 167 of the 2010 Priceline annual report below. You can navigate through the pages in the report by either clicking on the pages listed below, or by using the keyword search tool below to find specific information within the annual report.-
 1
1 -
2
-
3
-
4
-
5
-
6
-
7
-
8
-
9
-
10
-
11
-
12
-
13
-
14
-
15
-
16
-
17
-
18
-
19
-
20
-
21
-
22
-
23
-
24
-
25
-
26
-
27
-
28
-
29
-
30
-
31
-
32
-
33
-
34
-
35
-
36
-
37
-
38
-
39
-
40
-
41
-
42
-
43
-
44
-
45
-
46
-
47
-
48
-
49
-
50
-
51
-
52
-
53
-
54
-
55
-
56
-
57
-
58
-
59
-
60
-
61
-
62
-
63
-
64
-
65
-
66
-
67
-
68
-
69
-
70
-
71
-
72
-
73
-
74
-
75
-
76
-
77
-
78
-
79
-
80
-
81
-
82
-
83
-
84
-
85
-
86
-
87
-
88
-
89
-
90
-
91
-
92
-
93
-
94
-
95
-
96
-
97
-
98
-
99
-
100
-
101
-
102
-
103
-
104
-
105
-
106
-
107
-
108
-
109
-
110
-
111
-
112
-
113
-
114
-
115
-
116
-
117
-
118
-
119
-
120
-
121
-
122
-
123
-
124
-
125
-
126
-
127
-
128
-
129
-
130
-
131
-
132
-
133
-
134
-
135
-
136
-
137
-
138
-
139
-
140
-
141
-
142
-
143
-
144
-
145
-
146
-
147
-
148
-
149
-
150
-
151
-
152
-
153
-
154
-
155
-
156
-
 157
157 -
 158
158 -
 159
159 -
 160
160 -
 161
161 -
 162
162 -
 163
163 -
 164
164 -
 165
165 -
 166
166 -
 167
167 -
 168
168 -
 169
169 -
 170
170 -
 171
171 -
 172
172 -
 173
173 -
 174
174 -
 175
175 -
 176
176 -
 177
177 -
178
-
179
-
180
-
181
-
182
-
183
-
184
-
185
-
186
-
187
-
188
-
189
-
190
-
191
-
192
-
193
-
194
-
195
-
196
-
197
-
198
-
199
-
200
 |
 |

93
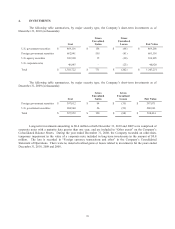
4. INVESTMENTS
The following table summarizes, by major security type, the Company’s short-term investments as of
December 31, 2010 (in thousands):
Cost
Gross
Unrealized
Gains
Gross
Unrealized
Losses
Fair Value
U.S. government securities $ 469,116 $ 158 $ (66) $ 469,208
Foreign government securities 682,841 558 (81) 683,318
U.S. agency securities 109,920 15 (30) 109,905
U.S. corporate notes 40,845 - (25) 40,820
Total $ 1,302,722 $ 731 $ (202) $ 1,303,251
The following table summarizes, by major security type, the Company’s short-term investments as of
December 31, 2009 (in thousands):
Cost
Gross
Unrealized
Gains
Gross
Unrealized
Losses
Fair Value
Foreign government securities $ 397,012 $ 94 $ (35) $ 397,071
U.S. government securities 200,940 56 (53) 200,943
Total $ 597,952 $ 150 $ (88) $ 598,014
Long-term investments amounting to $0.4 million at both December 31, 2010 and 2009 were comprised of
corporate notes with a maturity date greater than one year, and are included in “Other assets” on the Company’s
Consolidated Balance Sheets. During the year ended December 31, 2008, the Company recorded an other-than-
temporary impairment in the value of a corporate note included in long-term investments in the amount of $0.8
million. The loss is recorded in “Foreign currency transactions and other” in the Company’s Consolidated
Statement of Operations. There were no material realized gains or losses related to investments for the years ended
December 31, 2010, 2009 and 2008.