Priceline 2010 Annual Report Download - page 121
Download and view the complete annual report
Please find page 121 of the 2010 Priceline annual report below. You can navigate through the pages in the report by either clicking on the pages listed below, or by using the keyword search tool below to find specific information within the annual report.-
 1
1 -
2
-
3
-
4
-
5
-
6
-
7
-
8
-
9
-
10
-
11
-
12
-
13
-
14
-
15
-
16
-
17
-
18
-
19
-
20
-
21
-
22
-
23
-
24
-
25
-
26
-
27
-
28
-
29
-
30
-
31
-
32
-
33
-
34
-
35
-
36
-
37
-
38
-
39
-
40
-
41
-
42
-
43
-
44
-
45
-
46
-
47
-
48
-
49
-
50
-
51
-
52
-
53
-
54
-
55
-
56
-
57
-
58
-
59
-
60
-
61
-
62
-
63
-
64
-
65
-
66
-
67
-
68
-
69
-
70
-
71
-
72
-
73
-
74
-
75
-
76
-
77
-
78
-
79
-
80
-
81
-
82
-
83
-
84
-
85
-
86
-
87
-
88
-
89
-
90
-
91
-
92
-
93
-
94
-
95
-
96
-
97
-
98
-
99
-
100
-
101
-
102
-
103
-
104
-
105
-
106
-
107
-
108
-
109
-
110
-
 111
111 -
 112
112 -
 113
113 -
 114
114 -
 115
115 -
 116
116 -
 117
117 -
 118
118 -
 119
119 -
 120
120 -
 121
121 -
 122
122 -
 123
123 -
 124
124 -
 125
125 -
 126
126 -
 127
127 -
 128
128 -
 129
129 -
 130
130 -
 131
131 -
132
-
133
-
134
-
135
-
136
-
137
-
138
-
139
-
140
-
141
-
142
-
143
-
144
-
145
-
146
-
147
-
148
-
149
-
150
-
151
-
152
-
153
-
154
-
155
-
156
-
157
-
158
-
159
-
160
-
161
-
162
-
163
-
164
-
165
-
166
-
167
-
168
-
169
-
170
-
171
-
172
-
173
-
174
-
175
-
176
-
177
-
178
-
179
-
180
-
181
-
182
-
183
-
184
-
185
-
186
-
187
-
188
-
189
-
190
-
191
-
192
-
193
-
194
-
195
-
196
-
197
-
198
-
199
-
200
 |
 |

47
and amount of material, nonrecurring pro forma adjustments. This guidance is effective for business combinations
consummated in periods after December 15, 2010, and should be applied prospectively as of the date of adoption.
Early adoption of this guidance is permitted.
In January 2010, the accounting requirements for fair value measurements were modified to provide
disclosures about transfers into and out of Levels 1 and 2, separate detail of activity relating to Level 3
measurements, and disclosure by class of asset and liability as opposed to disclosure by the major category of assets
and liabilities, which was often interpreted as a line item on the balance sheet. The accounting guidance also
clarifies for Level 2 and Level 3 measurements that a description of the valuation techniques and inputs used to
measure fair value and a discussion of changes in valuation techniques or inputs, if any, are required for both
recurring and nonrecurring fair value measurements. If the guidance issued in January 2010 is not adopted early, it
is effective for the first reporting period, including interim periods, beginning after December 15, 2009, except for
the requirement to provide detail activity of Level 3 measurements, which will be effective beginning after
December 15, 2010. We adopted this 2010 guidance effective with the three months ended March 31, 2010. See
Note 5 to the Consolidated Financial Statements for information on fair value measurements.
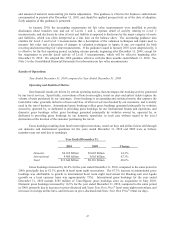
Results of Operations
Year Ended December 31, 2010 compared to Year Ended December 31, 2009
Operating and Statistical Metrics
Our financial results are driven by certain operating metrics that encompass the booking activity generated
by our travel services. Specifically, reservations of hotel room nights, rental car days and airline tickets capture the
volume of units purchased by our customers. Gross bookings is an operating and statistical metric that captures the
total dollar value, generally inclusive of taxes and fees, of all travel services booked by our customers, and is widely
used in the travel business. International gross bookings reflect gross bookings generated principally by websites
owned by, operated by, or dedicated to providing gross bookings for our international brands and operations, and
domestic gross bookings reflect gross bookings generated principally by websites owned by, operated by, or
dedicated to providing gross bookings by our domestic operations, in each case without regard to the travel
destination or the location of the customer purchasing the travel.
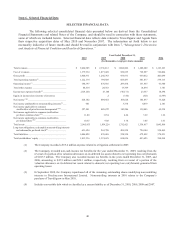
Gross bookings resulting from hotel room night reservations, rental car days and airline tickets sold through
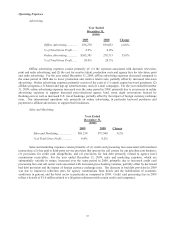
our domestic and international operations for the years ended December 31, 2010 and 2009 were as follows
(numbers may not total due to rounding):
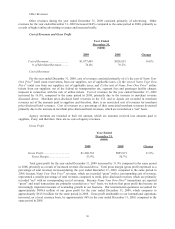
Year Ended December 31,
2010 2009 Change
Domestic $4.166 billion $3.645 billion 14.3%
International 9.480 billion 5.665 billion 67.3%
Total $13.646 billion $9.310 billion 46.6%
Gross bookings increased by 46.6% for the year ended December 31, 2010, compared to the same period in
2009, principally due to 52.3% growth in hotel room night reservations. The 67.3% increase in international gross
bookings was attributable to growth in international hotel room night reservations for Booking.com and Agoda
(growth on a local currency basis was approximately 73%). International gross bookings for the year ended
December 31, 2010 include $185 million of TravelJigsaw gross bookings since its acquisition in May 2010.
Domestic gross bookings increased by 14.3% for the year ended December 31, 2010, compared to the same period
in 2009, primarily due to increases in price-disclosed and Name Your Own Price® hotel room night reservations, and
increases in average airline fares, and increases in price-disclosed and Name Your Own Price® rental car days.