Priceline 2010 Annual Report Download - page 132
Download and view the complete annual report
Please find page 132 of the 2010 Priceline annual report below. You can navigate through the pages in the report by either clicking on the pages listed below, or by using the keyword search tool below to find specific information within the annual report.-
 1
1 -
2
-
3
-
4
-
5
-
6
-
7
-
8
-
9
-
10
-
11
-
12
-
13
-
14
-
15
-
16
-
17
-
18
-
19
-
20
-
21
-
22
-
23
-
24
-
25
-
26
-
27
-
28
-
29
-
30
-
31
-
32
-
33
-
34
-
35
-
36
-
37
-
38
-
39
-
40
-
41
-
42
-
43
-
44
-
45
-
46
-
47
-
48
-
49
-
50
-
51
-
52
-
53
-
54
-
55
-
56
-
57
-
58
-
59
-
60
-
61
-
62
-
63
-
64
-
65
-
66
-
67
-
68
-
69
-
70
-
71
-
72
-
73
-
74
-
75
-
76
-
77
-
78
-
79
-
80
-
81
-
82
-
83
-
84
-
85
-
86
-
87
-
88
-
89
-
90
-
91
-
92
-
93
-
94
-
95
-
96
-
97
-
98
-
99
-
100
-
101
-
102
-
103
-
104
-
105
-
106
-
107
-
108
-
109
-
110
-
111
-
112
-
113
-
114
-
115
-
116
-
117
-
118
-
119
-
120
-
121
-
 122
122 -
 123
123 -
 124
124 -
 125
125 -
 126
126 -
 127
127 -
 128
128 -
 129
129 -
 130
130 -
 131
131 -
 132
132 -
 133
133 -
 134
134 -
 135
135 -
 136
136 -
 137
137 -
 138
138 -
 139
139 -
 140
140 -
 141
141 -
 142
142 -
143
-
144
-
145
-
146
-
147
-
148
-
149
-
150
-
151
-
152
-
153
-
154
-
155
-
156
-
157
-
158
-
159
-
160
-
161
-
162
-
163
-
164
-
165
-
166
-
167
-
168
-
169
-
170
-
171
-
172
-
173
-
174
-
175
-
176
-
177
-
178
-
179
-
180
-
181
-
182
-
183
-
184
-
185
-
186
-
187
-
188
-
189
-
190
-
191
-
192
-
193
-
194
-
195
-
196
-
197
-
198
-
199
-
200
 |
 |

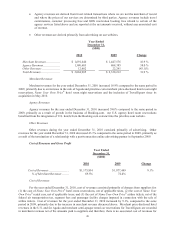
58
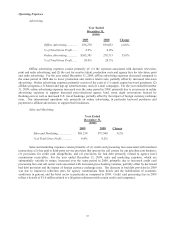
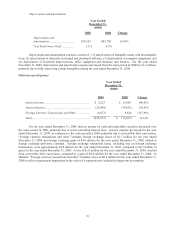
Personnel
Year Ended
December 31,
($000)
2009 2008 Change
Personnel .................................. $180,152 $163,785 10.0%
% of Total Gross Profit ............. 14.3% 17.1%
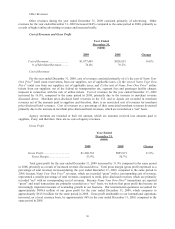
Personnel expenses consist of compensation to our personnel, including salaries, bonuses, taxes, employee
health benefits and stock-based compensation. For the year ended December 31, 2009, personnel expenses increased
over the same period in 2008, primarily due to increased compensation expenses associated with headcount growth,
partially offset by the impact of foreign currency exchange rates. Stock-based compensation expense was
approximately $40.7 million for the year ended December 31, 2009 and $40.5 million for the year ended December
31, 2008.
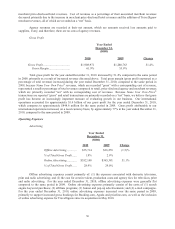
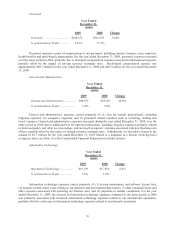
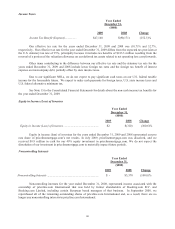
General and Administrative
Year Ended
December 31,
($000)
2009 2008 Change
General and Administrative ............... $68,555 $55,267 24.0%
% of Total Gross Profit ...................... 5.4% 5.8%
General and administrative expenses consist primarily of: (1) fees for outside professionals, including
litigation expenses; (2) occupancy expenses; and (3) personnel related expenses such as recruiting, training and
travel expenses. General and administrative expenses increased during the year ended December 31, 2009, over the
same period in 2008, due to additional fees for outside professionals, including litigation expenses primarily related
to hotel occupancy and other tax proceedings, and increased occupancy expenses associated with new Booking.com
offices, partially offset by the impact of foreign currency exchange rates. Additionally, we recorded a charge in the
amount of $3.7 million for the year ended December 31, 2009 related to a judgment in a lawsuit involving hotel
occupancy taxes (see Note 16 to the Consolidated Financial Statements for further details).
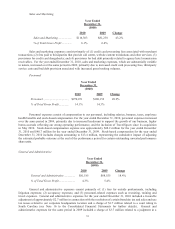
Information Technology
Year Ended
December 31,
($000)
2009 2008 Change
Information Technology .................. $19,139 $17,956 6.6%
% of Total Gross Profit ................... 1.5% 1.9%
Information technology expenses consist primarily of: (1) system maintenance and software license fees;
(2) outsourced data center costs relating to our domestic and international data centers; (3) data communications and
other expenses associated with operating our Internet sites; and (4) payments to outside consultants. For the year
ended December 31, 2009, the increase in information technology expenses compared to the same period in 2008
was primarily associated with increased information technology expenses related to our international operations,
partially offset by a decrease in information technology expenses related to our domestic operations.