Priceline 2010 Annual Report Download - page 188
Download and view the complete annual report
Please find page 188 of the 2010 Priceline annual report below. You can navigate through the pages in the report by either clicking on the pages listed below, or by using the keyword search tool below to find specific information within the annual report.-
 1
1 -
2
-
3
-
4
-
5
-
6
-
7
-
8
-
9
-
10
-
11
-
12
-
13
-
14
-
15
-
16
-
17
-
18
-
19
-
20
-
21
-
22
-
23
-
24
-
25
-
26
-
27
-
28
-
29
-
30
-
31
-
32
-
33
-
34
-
35
-
36
-
37
-
38
-
39
-
40
-
41
-
42
-
43
-
44
-
45
-
46
-
47
-
48
-
49
-
50
-
51
-
52
-
53
-
54
-
55
-
56
-
57
-
58
-
59
-
60
-
61
-
62
-
63
-
64
-
65
-
66
-
67
-
68
-
69
-
70
-
71
-
72
-
73
-
74
-
75
-
76
-
77
-
78
-
79
-
80
-
81
-
82
-
83
-
84
-
85
-
86
-
87
-
88
-
89
-
90
-
91
-
92
-
93
-
94
-
95
-
96
-
97
-
98
-
99
-
100
-
101
-
102
-
103
-
104
-
105
-
106
-
107
-
108
-
109
-
110
-
111
-
112
-
113
-
114
-
115
-
116
-
117
-
118
-
119
-
120
-
121
-
122
-
123
-
124
-
125
-
126
-
127
-
128
-
129
-
130
-
131
-
132
-
133
-
134
-
135
-
136
-
137
-
138
-
139
-
140
-
141
-
142
-
143
-
144
-
145
-
146
-
147
-
148
-
149
-
150
-
151
-
152
-
153
-
154
-
155
-
156
-
157
-
158
-
159
-
160
-
161
-
162
-
163
-
164
-
165
-
166
-
167
-
168
-
169
-
170
-
171
-
172
-
173
-
174
-
175
-
176
-
177
-
 178
178 -
 179
179 -
 180
180 -
 181
181 -
 182
182 -
 183
183 -
 184
184 -
 185
185 -
 186
186 -
 187
187 -
 188
188 -
 189
189 -
 190
190 -
 191
191 -
 192
192 -
 193
193 -
 194
194 -
 195
195 -
 196
196 -
 197
197 -
 198
198 -
199
-
200
 |
 |

114
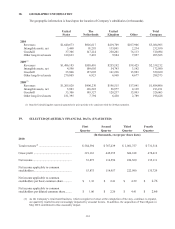
18. GEOGRAPHIC INFORMATION
The geographic information is based upon the location of Company’s subsidiaries (in thousands).
United
States
The
Netherlands
United
Kingdom
Other
Total
Company
2010
Revenues $1,640,673 $916,617 $419,709 $107,906 $3,084,905
Intangible assets, net 3,460 91,295 135,041 2,234 232,030
Goodwill 37,306 147,214 250,261 76,113 510,894
Other long-lived assets 180,623 7,401 9,584 7,957 205,565
2009(1)
Revenues $1,486,185 $558,410 $255,192 $38,425 $2,338,212
Intangible assets, net 4,590 109,605 54,743 3,142 172,080
Goodwill 35,806 157,605 141,226 15,993 350,630
Other long-lived assets 270,005 6,923 6,968 4,677 288,573
2008(1)
Revenues $1,265,020 $406,230 $196,515 $17,041 $1,884,806
Intangible assets, net 5,903 126,222 56,977 4,129 193,231
Goodwill 33,306 149,327 128,237 15,993 326,863
Other long-lived assets 181,395 7,794 6,450 2,789 198,428
(1) Data for United Kingdom reported separately for prior periods to be consistent with the 2010 presentation.
19. SELECTED QUARTERLY FINANCIAL DATA (UNAUDITED)
First Second Third Fourth
Quarter Quarter Quarter Quarter
(In thousands, except per share data)
2010
Total revenues(1) ............................................ $ 584,394 $ 767,439 $ 1,001,757 $ 731,316
Gross profit ................................................... 319,116 445,255 666,188 478,413
Net income ..................................................... 53,875 114,596 224,560 135,111
Net income applicable to common
stockholders ................................................... 53,875 114,957 222,980 135,729
Net income applicable to common
stockholders per basic common share ........... $ 1.16 $ 2.41 $ 4.59 $ 2.76
Net income applicable to common
stockholders per diluted common share ......... $ 1.06 $ 2.26 $ 4.41 $ 2.66
(1) As the Company’s retail hotel business, which recognizes revenue at the completion of the stay, continues to expand,
our quarterly results become increasingly impacted by seasonal factors. In addition, the acquisition of TravelJigsaw in
May 2010 contributed to this seasonality impact.