Priceline 2010 Annual Report Download - page 40
Download and view the complete annual report
Please find page 40 of the 2010 Priceline annual report below. You can navigate through the pages in the report by either clicking on the pages listed below, or by using the keyword search tool below to find specific information within the annual report.-
 1
1 -
2
-
3
-
4
-
5
-
6
-
7
-
8
-
9
-
10
-
11
-
12
-
13
-
14
-
15
-
16
-
17
-
18
-
19
-
20
-
21
-
22
-
23
-
24
-
25
-
26
-
27
-
28
-
29
-
 30
30 -
 31
31 -
 32
32 -
 33
33 -
 34
34 -
 35
35 -
 36
36 -
 37
37 -
 38
38 -
 39
39 -
 40
40 -
 41
41 -
 42
42 -
 43
43 -
 44
44 -
 45
45 -
 46
46 -
 47
47 -
 48
48 -
 49
49 -
 50
50 -
51
-
52
-
53
-
54
-
55
-
56
-
57
-
58
-
59
-
60
-
61
-
62
-
63
-
64
-
65
-
66
-
67
-
68
-
69
-
70
-
71
-
72
-
73
-
74
-
75
-
76
-
77
-
78
-
79
-
80
-
81
-
82
-
83
-
84
-
85
-
86
-
87
-
88
-
89
-
90
-
91
-
92
-
93
-
94
-
95
-
96
-
97
-
98
-
99
-
100
-
101
-
102
-
103
-
104
-
105
-
106
-
107
-
108
-
109
-
110
-
111
-
112
-
113
-
114
-
115
-
116
-
117
-
118
-
119
-
120
-
121
-
122
-
123
-
124
-
125
-
126
-
127
-
128
-
129
-
130
-
131
-
132
-
133
-
134
-
135
-
136
-
137
-
138
-
139
-
140
-
141
-
142
-
143
-
144
-
145
-
146
-
147
-
148
-
149
-
150
-
151
-
152
-
153
-
154
-
155
-
156
-
157
-
158
-
159
-
160
-
161
-
162
-
163
-
164
-
165
-
166
-
167
-
168
-
169
-
170
-
171
-
172
-
173
-
174
-
175
-
176
-
177
-
178
-
179
-
180
-
181
-
182
-
183
-
184
-
185
-
186
-
187
-
188
-
189
-
190
-
191
-
192
-
193
-
194
-
195
-
196
-
197
-
198
-
199
-
200
 |
 |

38
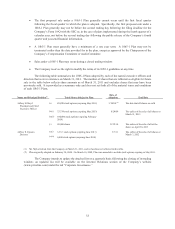
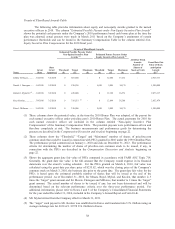
Grants of Plan-Based Awards Table
The following table provides information about equity and non-equity awards granted to the named
executive officers in 2010. The column “Estimated Possible Payouts under Non-Equity Incentive Plan Awards”
shows the potential cash payouts under the Company’s 2010 performance based cash bonus plan at the time the
plan was adopted; actual payouts were made in March 2011 based on the Company’s attainment of certain
performance thresholds and can be found in the Summary Compensation Table in the column entitled Non-
Equity Incentive Plan Compensation for the 2010 fiscal year.
Grants of Plan-Based Awards
Estimated Possible Payouts Under
Non-Equity Incentive Plan
Awards (1)
Estimated Future Payouts Under
Equity Incentive Plan Awards (2)
Name
Grant
Date
Date
Grant
Approved
Threshold
($)
Target
($)
Maximum
($)
Threshold
(#)
Target
(#)
Maximum
(#)
All Other Stock
Awards:
Number of
Shares of
Stock or Units
(#)
Grant Date Fair
Value of Stock
and Option
Awards
($)(3)
Jeffery H. Boyd ..........
.
3/4/2010
3/2/2010
0
687,500
-
0
12,404
37,212
-
2,925,111
Daniel J. Finnegan. ....
.
3/4/2010
3/2/2010
0
236,250
-
5,089
5,089
10,178
-
1,200,088
Robert J. Mylod Jr.(4) .
.
3/4/2010
3/2/2010
0
420,000
-
0
12,192
36,576
-
2,875,117
Kees Koolen ...............
.
3/4/2010
3/2/2010
0
319,531 (5)
-
0
12,096
36,288
-
2,852,479
Peter J. Millones ........
.
3/4/2010
3/2/2010
0
330,000
-
5,089
5,089
10,178
-
1,200,088
(1) These columns show the potential value, at the time the 2010 Bonus Plan was adopted, of the payout for
each named executive officer under priceline.com’s 2010 Bonus Plan. The actual payments for 2010 for
each named executive officer are included in the column entitled “Non-equity Incentive Plan
Compensation” of the Summary Compensation Table. The potential payouts were performance-driven and
therefore completely at risk. The business measurements and performance goals for determining the
payouts are described in the Compensation Discussion and Analysis beginning on page 22.
(2) These columns show the “Threshold,” “Target” and “Maximum” number of shares of priceline.com
common stock that could be issued in connection with PSUs granted in 2010 under the 1999 Omnibus Plan.
The performance period commenced on January 1, 2010 and ends on December 31, 2012. The performance
criteria for determining the number of shares of priceline.com common stock to be issued, if any, in
connection with the PSUs are described in the Compensation Discussion and Analysis beginning on
page 22.
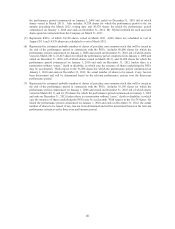
(3) Shows the aggregate grant date fair value of PSUs computed in accordance with FASB ASC Topic 718.
Generally, the grant date fair value is the full amount that the Company would expense in its financial
statements over the award’s vesting schedule. For the PSUs granted on March 4, 2010, fair value was
calculated using the grant date per share price of $235.82, which was the closing price of the Company’s
common stock on March 3, 2010, the business day prior to the grant date. The grant date fair value for the
PSUs is based upon the estimated probable number of shares that will be issued at the end of the
performance period. As of December 31, 2010, for Messrs. Boyd, Mylod, and Koolen, that number is 3
times the “target” grant amount and for Messrs. Finnegan and Millones, that number is 2 times the “target”
grant amount. The actual number of shares to be issued, if any, has not been determined and will be
determined based on the relevant performance criteria over the three-year performance period. For
additional information, please refer to Notes 2 and 3 of the Company’s Consolidated Financial Statements
for the year ended December 31, 2010, included in the Company’s Annual Report on Form 10-K.
(4) Mr. Mylod retired from the Company effective March 31, 2011.
(5) The “target” cash payout to Mr. Koolen was established in Euros and translated into U.S. Dollars using an
average exchange rate for 2010 of 1.32728 U.S. Dollars to Euros.