Priceline 2010 Annual Report Download - page 154
Download and view the complete annual report
Please find page 154 of the 2010 Priceline annual report below. You can navigate through the pages in the report by either clicking on the pages listed below, or by using the keyword search tool below to find specific information within the annual report.-
 1
1 -
2
-
3
-
4
-
5
-
6
-
7
-
8
-
9
-
10
-
11
-
12
-
13
-
14
-
15
-
16
-
17
-
18
-
19
-
20
-
21
-
22
-
23
-
24
-
25
-
26
-
27
-
28
-
29
-
30
-
31
-
32
-
33
-
34
-
35
-
36
-
37
-
38
-
39
-
40
-
41
-
42
-
43
-
44
-
45
-
46
-
47
-
48
-
49
-
50
-
51
-
52
-
53
-
54
-
55
-
56
-
57
-
58
-
59
-
60
-
61
-
62
-
63
-
64
-
65
-
66
-
67
-
68
-
69
-
70
-
71
-
72
-
73
-
74
-
75
-
76
-
77
-
78
-
79
-
80
-
81
-
82
-
83
-
84
-
85
-
86
-
87
-
88
-
89
-
90
-
91
-
92
-
93
-
94
-
95
-
96
-
97
-
98
-
99
-
100
-
101
-
102
-
103
-
104
-
105
-
106
-
107
-
108
-
109
-
110
-
111
-
112
-
113
-
114
-
115
-
116
-
117
-
118
-
119
-
120
-
121
-
122
-
123
-
124
-
125
-
126
-
127
-
128
-
129
-
130
-
131
-
132
-
133
-
134
-
135
-
136
-
137
-
138
-
139
-
140
-
141
-
142
-
143
-
 144
144 -
 145
145 -
 146
146 -
 147
147 -
 148
148 -
 149
149 -
 150
150 -
 151
151 -
 152
152 -
 153
153 -
 154
154 -
 155
155 -
 156
156 -
 157
157 -
 158
158 -
 159
159 -
 160
160 -
 161
161 -
 162
162 -
 163
163 -
 164
164 -
165
-
166
-
167
-
168
-
169
-
170
-
171
-
172
-
173
-
174
-
175
-
176
-
177
-
178
-
179
-
180
-
181
-
182
-
183
-
184
-
185
-
186
-
187
-
188
-
189
-
190
-
191
-
192
-
193
-
194
-
195
-
196
-
197
-
198
-
199
-
200
 |
 |

80
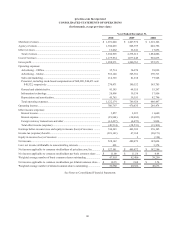
priceline.com Incorporated
CONSOLIDATED STATEMENTS OF OPERATIONS
(In thousands, except per share data)
Year Ended December 31,
2010 2009 2008
Merchant revenues ........................................................................................... $ 1,691,640 $ 1,447,576 $ 1,218,162
Agency revenues .............................................................................................. 1,380,603 868,395 648,792
Other revenues ................................................................................................. 12,662 22,241 17,852
Total revenues .............................................................................................. 3,084,905 2,338,212 1,884,806
Cost of revenues .............................................................................................. 1,175,934 1,077,449 928,835
Gross profit ...................................................................................................... 1,908,971 1,260,763 955,971
Operating expenses:
Advertising – Offline ................................................................................... 35,714 36,270 38,032
Advertising – Online .................................................................................... 552,140 365,381 270,713
Sales and marketing ..................................................................................... 116,303 81,238 77,948
Personnel, including stock-based compensation of $68,200, $40,671 and
$40,522, respectively ............................................................................... 270,071 180,152 163,785
General and administrative .......................................................................... 81,185 68,555 55,267
Information technology ................................................................................ 20,998 19,139 17,956
Depreciation and amortization ..................................................................... 45,763 39,193 42,796
Total operating expenses .............................................................................. 1,122,174 789,928 666,497
Operating income ............................................................................................. 786,797 470,835 289,474
Other income (expense):
Interest income ............................................................................................. 3,857 2,223 11,660
Interest expense ........................................................................................... (29,944) (24,084) (34,853)
Foreign currency transactions and other ...................................................... (14,427) (6,672) 9,824
Total other income (expense) ....................................................................... (40,514) (28,533) (13,369)
Earnings before income taxes and equity in income (loss) of investees ......... 746,283 442,302 276,105
Income tax (expense) benefit ........................................................................... (218,141) 47,168 (90,171)
Equity in income (loss) of investees ............................................................... - 2 (310)
Net income ....................................................................................................... 528,142 489,472 185,624
Less: net income attributable to noncontrolling interests ................................. 601 - 3,378
Net income applicable to common stockholders of priceline.com, Inc. ........... $ 527,541 $ 489,472 $ 182,246
Net income applicable to common stockholders per basic common share ...... $ 11.00 $ 11.54 $ 4.64
Weighted average number of basic common shares outstanding ..................... 47,955 42,406 39,299
Net income applicable to common stockholders per diluted common share .... $ 10.35 $ 9.88 $ 3.74
Weighted average number of diluted common shares outstanding .................. 50,988 49,522 48,671
See Notes to Consolidated Financial Statements.