Priceline 2010 Annual Report Download - page 168
Download and view the complete annual report
Please find page 168 of the 2010 Priceline annual report below. You can navigate through the pages in the report by either clicking on the pages listed below, or by using the keyword search tool below to find specific information within the annual report.-
 1
1 -
2
-
3
-
4
-
5
-
6
-
7
-
8
-
9
-
10
-
11
-
12
-
13
-
14
-
15
-
16
-
17
-
18
-
19
-
20
-
21
-
22
-
23
-
24
-
25
-
26
-
27
-
28
-
29
-
30
-
31
-
32
-
33
-
34
-
35
-
36
-
37
-
38
-
39
-
40
-
41
-
42
-
43
-
44
-
45
-
46
-
47
-
48
-
49
-
50
-
51
-
52
-
53
-
54
-
55
-
56
-
57
-
58
-
59
-
60
-
61
-
62
-
63
-
64
-
65
-
66
-
67
-
68
-
69
-
70
-
71
-
72
-
73
-
74
-
75
-
76
-
77
-
78
-
79
-
80
-
81
-
82
-
83
-
84
-
85
-
86
-
87
-
88
-
89
-
90
-
91
-
92
-
93
-
94
-
95
-
96
-
97
-
98
-
99
-
100
-
101
-
102
-
103
-
104
-
105
-
106
-
107
-
108
-
109
-
110
-
111
-
112
-
113
-
114
-
115
-
116
-
117
-
118
-
119
-
120
-
121
-
122
-
123
-
124
-
125
-
126
-
127
-
128
-
129
-
130
-
131
-
132
-
133
-
134
-
135
-
136
-
137
-
138
-
139
-
140
-
141
-
142
-
143
-
144
-
145
-
146
-
147
-
148
-
149
-
150
-
151
-
152
-
153
-
154
-
155
-
156
-
157
-
 158
158 -
 159
159 -
 160
160 -
 161
161 -
 162
162 -
 163
163 -
 164
164 -
 165
165 -
 166
166 -
 167
167 -
 168
168 -
 169
169 -
 170
170 -
 171
171 -
 172
172 -
 173
173 -
 174
174 -
 175
175 -
 176
176 -
 177
177 -
 178
178 -
179
-
180
-
181
-
182
-
183
-
184
-
185
-
186
-
187
-
188
-
189
-
190
-
191
-
192
-
193
-
194
-
195
-
196
-
197
-
198
-
199
-
200
 |
 |

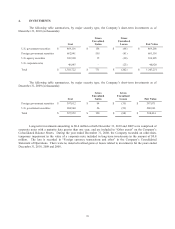
94
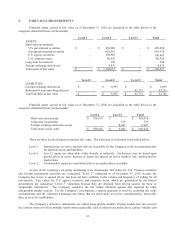
5. FAIR VALUE MEASUREMENTS
Financial assets carried at fair value as of December 31, 2010 are classified in the table below in the
categories described below (in thousands):
Level 1 Level 2 Level 3 Total
ASSETS:
Short-term investments
U.S. government securities $ - $ 469,208 $ - $ 469,208
Foreign government securities - 683,318 - 683,318
U.S. agency securities - 109,905 - 109,905
U.S. corporate notes - 40,820 - 40,820
Long-term investments - 394 - 394
Foreign exchange derivatives - 4,970 - 4,970
Total assets at fair value $ - $ 1,308,615 $ - $ 1,308,615
Level 1 Level 2 Level 3 Total
LIABILITIES:
Foreign exchange derivatives $ - $ 6,995 $ - $ 6,995
Redeemable noncontrolling interests - - 45,751 45,751
Total liabilities at fair value $ - $ 6,995 $ 45,751 $ 52,746
Financial assets carried at fair value as of December 31, 2009 are classified in the table below in the
categories described below (in thousands):
Level 1 Level 2 Total
Short-term investments $ 598,014 $ - $ 598,014
Long-term investments - 359 359
Foreign exchange derivative assets - 8,047 8,047
Total assets at fair value $ 598,014 $ 8,406 $ 606,420
There are three levels of inputs to measure fair value. The definition of each input is described below:
Level 1: Quoted prices in active markets that are accessible by the Company at the measurement date
for identical assets and liabilities.
Level 2: Level 2 inputs are observable, either directly or indirectly. Such prices may be based upon
quoted prices in active markets or inputs not quoted on active markets, but corroborated by
market data.
Level 3: Unobservable inputs are used when little or no market data is available.
As part of the Company’s on-going monitoring of its investments, fair values for U.S. Treasury securities
and foreign government securities are considered “Level 2” valuations as of December 31, 2010 because the
Company has access to quoted prices, but does not have visibility to the volume and frequency of trading for all
investments. Fair values for U.S. agency securities and corporate notes, which are guaranteed by the federal
government, are considered “Level 2” valuations because they are obtained from pricing sources for these or
comparable instruments. The Company compares the fair values obtained against data reported by other
independent market sources. For the Company’s investments, a market approach is used for recurring fair value
measurements and the valuation techniques use inputs that are observable, or can be corroborated by observable
data, in an active marketplace.
The Company’s derivative instruments are valued using pricing models. Pricing models take into account
the contract terms as well as multiple inputs where applicable, such as interest rate yield curves, option volatility and