Priceline 2010 Annual Report Download - page 128
Download and view the complete annual report
Please find page 128 of the 2010 Priceline annual report below. You can navigate through the pages in the report by either clicking on the pages listed below, or by using the keyword search tool below to find specific information within the annual report.-
 1
1 -
2
-
3
-
4
-
5
-
6
-
7
-
8
-
9
-
10
-
11
-
12
-
13
-
14
-
15
-
16
-
17
-
18
-
19
-
20
-
21
-
22
-
23
-
24
-
25
-
26
-
27
-
28
-
29
-
30
-
31
-
32
-
33
-
34
-
35
-
36
-
37
-
38
-
39
-
40
-
41
-
42
-
43
-
44
-
45
-
46
-
47
-
48
-
49
-
50
-
51
-
52
-
53
-
54
-
55
-
56
-
57
-
58
-
59
-
60
-
61
-
62
-
63
-
64
-
65
-
66
-
67
-
68
-
69
-
70
-
71
-
72
-
73
-
74
-
75
-
76
-
77
-
78
-
79
-
80
-
81
-
82
-
83
-
84
-
85
-
86
-
87
-
88
-
89
-
90
-
91
-
92
-
93
-
94
-
95
-
96
-
97
-
98
-
99
-
100
-
101
-
102
-
103
-
104
-
105
-
106
-
107
-
108
-
109
-
110
-
111
-
112
-
113
-
114
-
115
-
116
-
117
-
 118
118 -
 119
119 -
 120
120 -
 121
121 -
 122
122 -
 123
123 -
 124
124 -
 125
125 -
 126
126 -
 127
127 -
 128
128 -
 129
129 -
 130
130 -
 131
131 -
 132
132 -
 133
133 -
 134
134 -
 135
135 -
 136
136 -
 137
137 -
 138
138 -
139
-
140
-
141
-
142
-
143
-
144
-
145
-
146
-
147
-
148
-
149
-
150
-
151
-
152
-
153
-
154
-
155
-
156
-
157
-
158
-
159
-
160
-
161
-
162
-
163
-
164
-
165
-
166
-
167
-
168
-
169
-
170
-
171
-
172
-
173
-
174
-
175
-
176
-
177
-
178
-
179
-
180
-
181
-
182
-
183
-
184
-
185
-
186
-
187
-
188
-
189
-
190
-
191
-
192
-
193
-
194
-
195
-
196
-
197
-
198
-
199
-
200
 |
 |

54
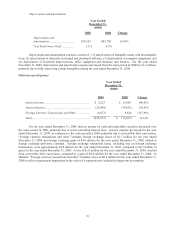
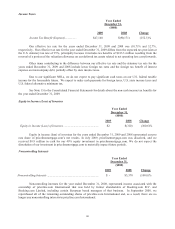
Noncontrolling Interests
Year Ended
December 31,
($000)
2010 2009 Change
Noncontrolling Interests Income .......................................................... $601 n/a n/a
Noncontrolling interests for the year ended December 31, 2010, represents the proportionate share of the
net income of TravelJigsaw Holdings Limited for the period of May 18, 2010 through December 31, 2010,
applicable to the noncontrolling interests (refer to Note 13 of the Consolidated Financial Statements).
Results of Operations
Year Ended December 31, 2009 compared to Year Ended December 31, 2008
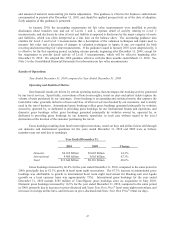
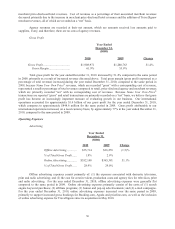
Operating and Statistical Metrics
Gross bookings resulting from hotel room night reservations, rental car days and airline tickets sold through
our domestic and international operations for the years ended December 31, 2009 and 2008 were as follows
(numbers may not total due to rounding):
Year Ended December 31,
2009 2008 Change
Domestic $3.645 billion $3.082 billion 18.3%
International 5.665 billion 4.318 billion 31.2%
Total $9.310 billion $7.400 billion 25.8%
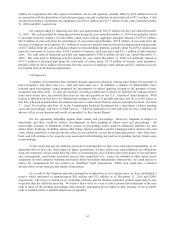
Gross bookings increased by 25.8% for the year ended December 31, 2009, compared to the same period in
2008, primarily due to 49.3% growth in hotel room night reservations, partially offset by year-over-year declines in
average selling prices for our hotel and airline ticket services in most markets. The 31.2%increase in international
gross bookings was attributable to growth in international hotel room night reservations for our Booking.com and
Agoda businesses. Domestic gross bookings increased by 18.3% for the year ended December 31, 2009, compared
to the same period in 2008, primarily due to growth in Name Your Own Price® hotel room night reservations, price-
disclosed airline tickets, merchant price-disclosed hotel room night reservations and price-disclosed rental car days,
partially offset by a decline in Name Your Own Price® airline tickets.
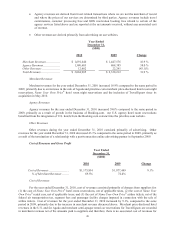
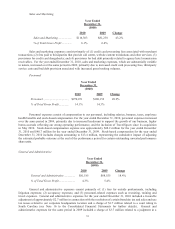
Gross bookings resulting from hotel room night reservations, rental car days and airline tickets sold through
our agency and merchant models for the years ended December 31, 2009 and 2008 were as follows (numbers may
not total due to rounding):
Year Ended December 31,
2009 2008 Change
Agency $7.191 billion $5.739 billion 25.3%
Merchant 2.119 billion 1.662 billion 27.5%
Total $9.310 billion $7.400 billion 25.8%
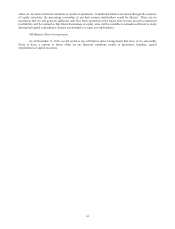
Agency gross bookings increased 25.3% for the year ended December 31, 2009, compared to the same
period in 2008, due to growth in the sale of Booking.com hotel room night reservations, price-disclosed airline
tickets and price-disclosed rental car days. Merchant gross bookings increased 27.5% for the year ended December
31, 2009, compared to the same period in 2008, due to an increase in the sale of Name Your Own Price® hotel room
night reservations, Agoda merchant price-disclosed hotel room night reservations and domestic merchant price-
disclosed hotel room night reservations, partially offset by a decline in Name Your Own Price® airline tickets.