Priceline 2010 Annual Report Download - page 178
Download and view the complete annual report
Please find page 178 of the 2010 Priceline annual report below. You can navigate through the pages in the report by either clicking on the pages listed below, or by using the keyword search tool below to find specific information within the annual report.-
 1
1 -
2
-
3
-
4
-
5
-
6
-
7
-
8
-
9
-
10
-
11
-
12
-
13
-
14
-
15
-
16
-
17
-
18
-
19
-
20
-
21
-
22
-
23
-
24
-
25
-
26
-
27
-
28
-
29
-
30
-
31
-
32
-
33
-
34
-
35
-
36
-
37
-
38
-
39
-
40
-
41
-
42
-
43
-
44
-
45
-
46
-
47
-
48
-
49
-
50
-
51
-
52
-
53
-
54
-
55
-
56
-
57
-
58
-
59
-
60
-
61
-
62
-
63
-
64
-
65
-
66
-
67
-
68
-
69
-
70
-
71
-
72
-
73
-
74
-
75
-
76
-
77
-
78
-
79
-
80
-
81
-
82
-
83
-
84
-
85
-
86
-
87
-
88
-
89
-
90
-
91
-
92
-
93
-
94
-
95
-
96
-
97
-
98
-
99
-
100
-
101
-
102
-
103
-
104
-
105
-
106
-
107
-
108
-
109
-
110
-
111
-
112
-
113
-
114
-
115
-
116
-
117
-
118
-
119
-
120
-
121
-
122
-
123
-
124
-
125
-
126
-
127
-
128
-
129
-
130
-
131
-
132
-
133
-
134
-
135
-
136
-
137
-
138
-
139
-
140
-
141
-
142
-
143
-
144
-
145
-
146
-
147
-
148
-
149
-
150
-
151
-
152
-
153
-
154
-
155
-
156
-
157
-
158
-
159
-
160
-
161
-
162
-
163
-
164
-
165
-
166
-
167
-
 168
168 -
 169
169 -
 170
170 -
 171
171 -
 172
172 -
 173
173 -
 174
174 -
 175
175 -
 176
176 -
 177
177 -
 178
178 -
 179
179 -
 180
180 -
 181
181 -
 182
182 -
 183
183 -
 184
184 -
 185
185 -
 186
186 -
 187
187 -
 188
188 -
189
-
190
-
191
-
192
-
193
-
194
-
195
-
196
-
197
-
198
-
199
-
200
 |
 |

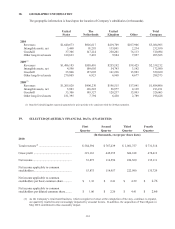
104
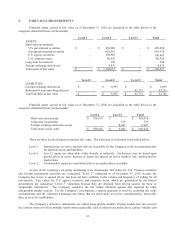
(1) Includes net gains from fair value adjustments at December 31, 2010 and December 31, 2009 associated with net
investment hedges of $15.8 million after tax ($27.1 million before tax) and $1.8 million after tax ($3.0 million
before tax), respectively. The remaining balance in currency translation adjustments excludes income taxes due to
the Company’s practice and intention to reinvest the earnings of its foreign subsidiaries in those operations.
(2) The unrealized gains before tax at December 31, 2010, 2009, and 2008 were $0.7 million, $0.2 million, and $0.1
million, respectively.
15. INCOME TAXES
Domestic pre-tax income was $136.3 million, $113.9 million and $66.1 million for the years ended
December 31, 2010, 2009 and 2008, respectively. Foreign pre-tax income was $610.0 million, $328.4 million and
$210.0 million for the years ended December 31, 2010, 2009 and 2008, respectively.
The income tax expense (benefit) for the year ended December 31, 2010 is as follows (in thousands):
Current Deferred Total
Federal $ 4,510 $ 37,481 $ 41,991
State 1,114 9,368 10,482
Foreign 174,977 (9,309) 165,668
Total $ 180,601 $ 37,540 $ 218,141
The income tax expense (benefit) for the year ended December 31, 2009 is as follows (in thousands):
Current Deferred Total
Federal $ 2,802 $ (150,935) $ (148,133)
State 1,107 6,803 7,910
Foreign 101,205 (8,150) 93,055
Total $ 105,114 $ (152,282) $ (47,168)
The income tax expense (benefit) for the year ended December 31, 2008 is as follows (in thousands):
Current Deferred Total
Federal $ 2,155 $ 22,615 $ 24,770
State 401 5,275 5,676
Foreign 67,716 (7,991) 59,725
Total $ 70,272 $ 19,899 $ 90,171
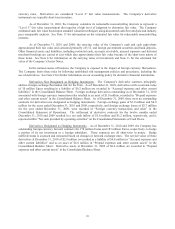
At December 31, 2010, the Company had approximately $2.7 billion of net operating loss carryforwards
for U.S. federal income tax purposes (“NOLs”), comprised of $0.6 billion of NOLs generated from operating losses
and approximately $2.1 billion of NOL tax benefits generated from equity-related transactions, including equity-
based compensation and stock warrants, mainly expiring from December 31, 2019 to December 31, 2021. The
utilization of these NOLs is subject to limitation under Section 382 of the Internal Revenue Code and is also
dependent upon the Company’s ability to generate sufficient future taxable income.
Section 382 imposes limitations on the availability of a company’s net operating losses after a more than 50
percentage point ownership change occurs. The Section 382 limitation is based upon certain conclusions pertaining
to the dates of ownership changes and the value of the Company on the dates of the ownership changes. It was
determined that ownership changes, as defined in Section 382, occurred in 2000 and 2002. The amount of the
Company’s net operating losses incurred prior to each ownership change is limited based on the value of the
Company on the respective dates of ownership change. It is estimated that the effect of Section 382 will generally
limit the total cumulative amount of net operating loss available to offset future taxable income to approximately
$1.3 billion. Pursuant to Section 382, subsequent ownership changes could further limit this amount.
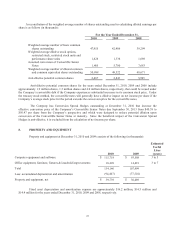
The Company periodically evaluates the likelihood of the realization of deferred tax assets, and reduces the
carrying amount of these deferred tax assets by a valuation allowance to the extent it believes a portion will not be
realized. The Company considers many factors when assessing the likelihood of future realization of the deferred
tax assets, including its recent cumulative earnings experience by taxing jurisdiction, expectations of future income,