Priceline 2010 Annual Report Download - page 155
Download and view the complete annual report
Please find page 155 of the 2010 Priceline annual report below. You can navigate through the pages in the report by either clicking on the pages listed below, or by using the keyword search tool below to find specific information within the annual report.-
 1
1 -
2
-
3
-
4
-
5
-
6
-
7
-
8
-
9
-
10
-
11
-
12
-
13
-
14
-
15
-
16
-
17
-
18
-
19
-
20
-
21
-
22
-
23
-
24
-
25
-
26
-
27
-
28
-
29
-
30
-
31
-
32
-
33
-
34
-
35
-
36
-
37
-
38
-
39
-
40
-
41
-
42
-
43
-
44
-
45
-
46
-
47
-
48
-
49
-
50
-
51
-
52
-
53
-
54
-
55
-
56
-
57
-
58
-
59
-
60
-
61
-
62
-
63
-
64
-
65
-
66
-
67
-
68
-
69
-
70
-
71
-
72
-
73
-
74
-
75
-
76
-
77
-
78
-
79
-
80
-
81
-
82
-
83
-
84
-
85
-
86
-
87
-
88
-
89
-
90
-
91
-
92
-
93
-
94
-
95
-
96
-
97
-
98
-
99
-
100
-
101
-
102
-
103
-
104
-
105
-
106
-
107
-
108
-
109
-
110
-
111
-
112
-
113
-
114
-
115
-
116
-
117
-
118
-
119
-
120
-
121
-
122
-
123
-
124
-
125
-
126
-
127
-
128
-
129
-
130
-
131
-
132
-
133
-
134
-
135
-
136
-
137
-
138
-
139
-
140
-
141
-
142
-
143
-
144
-
 145
145 -
 146
146 -
 147
147 -
 148
148 -
 149
149 -
 150
150 -
 151
151 -
 152
152 -
 153
153 -
 154
154 -
 155
155 -
 156
156 -
 157
157 -
 158
158 -
 159
159 -
 160
160 -
 161
161 -
 162
162 -
 163
163 -
 164
164 -
 165
165 -
166
-
167
-
168
-
169
-
170
-
171
-
172
-
173
-
174
-
175
-
176
-
177
-
178
-
179
-
180
-
181
-
182
-
183
-
184
-
185
-
186
-
187
-
188
-
189
-
190
-
191
-
192
-
193
-
194
-
195
-
196
-
197
-
198
-
199
-
200
 |
 |

81
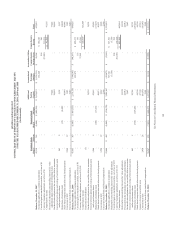
priceline.com Incorporated
CONSOLIDATED STATEMENTS OF CHANGES IN STOCKHOLDERS’ EQUITY
FOR THE YEARS ENDED DECEMBER 31, 2010, 2009 and 2008
(In thousands)
Additional Accumulated Accumulated Other
Common Stock Treasury Stock Paid-in Earnings Comprehensive Comprehensive
Shares Amount Shares Amount Capital (Deficit) Income (Loss) Income Total
Balance, December 31, 2007 45,118 $ 346 (6,646) $ (489,106) $ 2,018,432 $ (1,126,391) $ 50,344 $ 453,625
Net income applicable to common stockholders - - - - - 182,246 - $ 182,246
Unrealized gain on marketable securities, net of tax of $0 - - - - - - 260 260
Currency translation adjustment, net of tax of $0 - - - - - - (91,001) (91,001)
Comprehensive income $ 91,505 91,505
Reversal of redeemable noncontrolling interests fair value
adjustments upon redemption of remaining shares - - - - 77,442 - -
77,442
Reclassification adjustment for convertible debt in mezzanine - - - - 26,669 - - 26,669
Exercise of stock options and vesting of restricted stock units
and/or performance shares 283 2 - - 5,505 - -
5,507
Repurchase of common stock - - (39) (4,449) - - - (4,449)
Stock-based compensation and other stock based payments - - - - 40,448 - - 40,448
Conversion of debt 2,264 19 - - 1,023 - - 1,042
Excess tax benefit from stock-based compensation - - - - 7,037 - - 7,037
Balance, December 31, 2008 47,665 $ 367 (6,685) $ (493,555) $ 2,176,556 $ ( 944,145) $ (40,397) $ 698,826
Net income applicable to common stockholders - - - - - 489,472 - $ 489,472
Unrealized gain on marketable securities, net of tax of $0 - - - - - - 116 116
Currency translation adjustment, net of tax of $1,209 - - - - - - 37,281 37,281
Comprehensive income $ 526,869 526,869
Restricted stock forfeitures (3) - - - - - - -
Reclassification adjustment for convertible debt in mezzanine - - - - 18,203 - - 18,203
Exercise of stock options and vesting of restricted stock units
and/ or performance shares 1,200 9 - - 43,419 - -
43,428
Repurchase of common stock - - (180) (17,415) - - - (17,415)
Stock-based compensation and other stock based payments - - - - 40,671 - - 40,671
Conversion of debt 3,584 29 - - 8,869 - - 8,898
Excess tax benefit from stock-based compensation - - - - 2,149 - - 2,149
Balance, December 31, 2009 52,446 $ 405 (6,865) $ (510,970) $ 2,289,867 $ (454,673) $ (3,000) $ 1,321,629
Net income applicable to common stockholders - - - - - 527,541 - $ 527,541
Redeemable noncontrolling interests fair value adjustment - - - - - (3,758) - (3,758)
Unrealized gain on marketable securities, net of tax of $175 - - - - - - 294 294
Currency translation adjustment, net of tax of $11,311 - - - - - - (30,183) (30,183)
Comprehensive income $ 493,894 493,894
Redeemable noncontrolling interests fair value adjustments - - - - (4,118) - - (4,118)
Proceeds from the termination of conversion spread hedges 42,984 42,984
Reclassification adjustment for convertible debt in mezzanine - - - - 3,683 - - 3,683
Exercise of stock options and vesting of restricted stock units
and/or performance shares 663 5 - - 25,746 - -
25,751
Repurchase of common stock - - (556) (129,445) - - - (129,445)
Stock-based compensation and other stock-based payments - - - - 68,396 - - 68,396
Issuance of senior convertible notes - - - - 67,516 - - 67,516
Conversion of debt 3,458 28 - - (80,073) - - (80,045)
Excess tax benefit from stock-based compensation - - - - 3,091 - - 3,091
Balance, December 31, 2010 56,567 $ 438 (7,421) $ (640,415) $ 2,417,092 $ 69,110 $ (32,889) $ 1,813,336
See Notes to Consolidated Financial Statements.