Priceline 2010 Annual Report Download - page 165
Download and view the complete annual report
Please find page 165 of the 2010 Priceline annual report below. You can navigate through the pages in the report by either clicking on the pages listed below, or by using the keyword search tool below to find specific information within the annual report.-
 1
1 -
2
-
3
-
4
-
5
-
6
-
7
-
8
-
9
-
10
-
11
-
12
-
13
-
14
-
15
-
16
-
17
-
18
-
19
-
20
-
21
-
22
-
23
-
24
-
25
-
26
-
27
-
28
-
29
-
30
-
31
-
32
-
33
-
34
-
35
-
36
-
37
-
38
-
39
-
40
-
41
-
42
-
43
-
44
-
45
-
46
-
47
-
48
-
49
-
50
-
51
-
52
-
53
-
54
-
55
-
56
-
57
-
58
-
59
-
60
-
61
-
62
-
63
-
64
-
65
-
66
-
67
-
68
-
69
-
70
-
71
-
72
-
73
-
74
-
75
-
76
-
77
-
78
-
79
-
80
-
81
-
82
-
83
-
84
-
85
-
86
-
87
-
88
-
89
-
90
-
91
-
92
-
93
-
94
-
95
-
96
-
97
-
98
-
99
-
100
-
101
-
102
-
103
-
104
-
105
-
106
-
107
-
108
-
109
-
110
-
111
-
112
-
113
-
114
-
115
-
116
-
117
-
118
-
119
-
120
-
121
-
122
-
123
-
124
-
125
-
126
-
127
-
128
-
129
-
130
-
131
-
132
-
133
-
134
-
135
-
136
-
137
-
138
-
139
-
140
-
141
-
142
-
143
-
144
-
145
-
146
-
147
-
148
-
149
-
150
-
151
-
152
-
153
-
154
-
 155
155 -
 156
156 -
 157
157 -
 158
158 -
 159
159 -
 160
160 -
 161
161 -
 162
162 -
 163
163 -
 164
164 -
 165
165 -
 166
166 -
 167
167 -
 168
168 -
 169
169 -
 170
170 -
 171
171 -
 172
172 -
 173
173 -
 174
174 -
 175
175 -
176
-
177
-
178
-
179
-
180
-
181
-
182
-
183
-
184
-
185
-
186
-
187
-
188
-
189
-
190
-
191
-
192
-
193
-
194
-
195
-
196
-
197
-
198
-
199
-
200
 |
 |

91
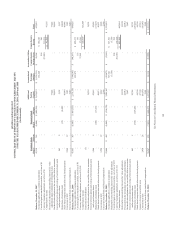
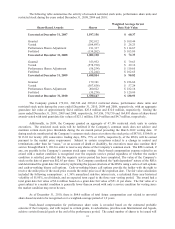
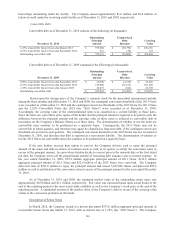
The following table summarizes the activity of unvested restricted stock units, performance share units and
restricted stock during the years ended December 31, 2008, 2009 and 2010:
Share-Based Awards
Shares
Weighted Average Grant
Date Fair Value
Unvested at December 31, 2007 1,597,156 $ 60.37
Granted 292,812 $ 109.44
Vested (164,893) $ 28.23
Performance Shares Adjustment 211,337 $ 114.67
Forfeited (134,262) $ 105.00
Unvested at December 31, 2008 1,802,150 $ 74.33
Granted 353,932 $ 79.63
Vested (578,730) $ 29.16
Performance Shares Adjustment (56,254) $ 119.65
Forfeited (32,244) $ 102.65
Unvested at December 31, 2009 1,488,854 $ 90.82
Granted 179,101 $ 236.66
Vested (367,856) $ 57.24
Performance Shares Adjustment 260,822 $ 182.16
Forfeited (30,274) $ 120.80
Unvested at December 31, 2010 1,530,647 $ 130.93
The Company granted 179,101, 306,746 and 292,812 restricted shares, performance share units and
restricted stock units during the years ended December 31, 2010, 2009 and 2008, respectively, with an aggregate
grant-date fair value of approximately $42.4 million, $25.8 million and $32.0 million, respectively. During the
years ended December 31, 2010, 2009 and 2008, respectively, 367,856, 578,730 and 164,893 shares of share-based
awards vested with total grant date fair values of $21.1 million, $16.9 million and $4.7 million, respectively.
Additionally, in 2009, the Company granted an aggregate of 47,186 restricted stock units to certain
executives. The restricted stock units will be forfeited if the Company’s common stock does not achieve and
maintain certain stock price thresholds during the six month period preceding the March 2012 vesting date. If
during such six month period the Company’s common stock closes at or above the stock price of $97.05, $104.69, or
$113.03 for twenty (20) consecutive trading days, 50%, 75% or 100%, respectively, of the RSUs will be earned
pursuant to the market price requirement. Subject to certain exceptions related to a change in control and
terminations other than for “cause,” or on account of death or disability, the executives must also continue their
service through March 3, 2012 in order to receive any shares of the Company’s common stock. The RSUs earned, if
any, are payable in the Company’s common stock upon vesting. Stock-based compensation expense related to an
award with a market condition is recognized over the requisite service period regardless of whether the market
condition is satisfied, provided that the requisite service period has been completed. The value of the Company’s
stock on the date of grant was $82.65 per share. The Company considered the “path dependent” nature of the RSUs
and determined the grant date fair value by replicating the payout structure of the RSUs using a series of call options
and cash-or-nothing binary call options. Cash-or-nothing binary call options provide the holder with the right to
receive the strike price if the stock price exceeds the strike price as of the expiration date. The fair value calculation
included the following assumptions: a 1.36% annualized risk-free interest rate, a calculated three year historical
volatility of 55.95%, no dividends, and an expected term equal to the three year vesting period. The award had a
total grant date fair value of $2.4 million based on a grant date fair value of $51.11 per share. The fair value of a
grant subject to a market condition is generally lower than an award with only a service condition for vesting since
the market condition may never be met.
As of December 31, 2010, there is $64.6 million of total future compensation cost related to unvested
share-based awards to be recognized over a weighted-average period of 1.9 years.
Stock-based compensation for performance share units is recorded based on the estimated probable
outcome if the Company, and with respect to certain grants, its subsidiaries, priceline.com International and Agoda,
achieve certain financial goals at the end of the performance period. The actual number of shares to be issued will