Priceline 2010 Annual Report Download - page 129
Download and view the complete annual report
Please find page 129 of the 2010 Priceline annual report below. You can navigate through the pages in the report by either clicking on the pages listed below, or by using the keyword search tool below to find specific information within the annual report.-
 1
1 -
2
-
3
-
4
-
5
-
6
-
7
-
8
-
9
-
10
-
11
-
12
-
13
-
14
-
15
-
16
-
17
-
18
-
19
-
20
-
21
-
22
-
23
-
24
-
25
-
26
-
27
-
28
-
29
-
30
-
31
-
32
-
33
-
34
-
35
-
36
-
37
-
38
-
39
-
40
-
41
-
42
-
43
-
44
-
45
-
46
-
47
-
48
-
49
-
50
-
51
-
52
-
53
-
54
-
55
-
56
-
57
-
58
-
59
-
60
-
61
-
62
-
63
-
64
-
65
-
66
-
67
-
68
-
69
-
70
-
71
-
72
-
73
-
74
-
75
-
76
-
77
-
78
-
79
-
80
-
81
-
82
-
83
-
84
-
85
-
86
-
87
-
88
-
89
-
90
-
91
-
92
-
93
-
94
-
95
-
96
-
97
-
98
-
99
-
100
-
101
-
102
-
103
-
104
-
105
-
106
-
107
-
108
-
109
-
110
-
111
-
112
-
113
-
114
-
115
-
116
-
117
-
118
-
 119
119 -
 120
120 -
 121
121 -
 122
122 -
 123
123 -
 124
124 -
 125
125 -
 126
126 -
 127
127 -
 128
128 -
 129
129 -
 130
130 -
 131
131 -
 132
132 -
 133
133 -
 134
134 -
 135
135 -
 136
136 -
 137
137 -
 138
138 -
 139
139 -
140
-
141
-
142
-
143
-
144
-
145
-
146
-
147
-
148
-
149
-
150
-
151
-
152
-
153
-
154
-
155
-
156
-
157
-
158
-
159
-
160
-
161
-
162
-
163
-
164
-
165
-
166
-
167
-
168
-
169
-
170
-
171
-
172
-
173
-
174
-
175
-
176
-
177
-
178
-
179
-
180
-
181
-
182
-
183
-
184
-
185
-
186
-
187
-
188
-
189
-
190
-
191
-
192
-
193
-
194
-
195
-
196
-
197
-
198
-
199
-
200
 |
 |

55
Year Ended
Hotel Room
Nights
Rental
Car Days
Airline
Tickets
December 31, 2009 60.9 million 11.2 million 5.9 million
December 31, 2008 40.8 million 10.0 million 4.9 million
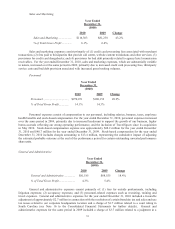
Hotel room night reservations sold increased by 49.3% for the year ended December 31, 2009, over the
same period in 2008, primarily due to an increase in the sale of Booking.com agency room night reservations, as
well as an increase in the sale of Name Your Own Price® room night reservations and Agoda and domestic price-
disclosed room night reservations.
Rental car days sold increased by 12.4% for the year ended December 31, 2009, over the same period in
2008, primarily due to an increase in the sale of price-disclosed rental car days, as well as an increase in Name Your
Own Price® rental car days.
Airline tickets sold increased by 21.8% for the year ended December 31, 2009, over the same period in
2008, due to an increase in the sale of price-disclosed airline tickets, partially offset by a decline in Name Your Own
Price® airline tickets.
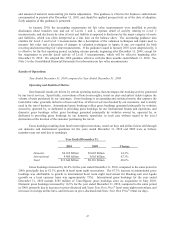
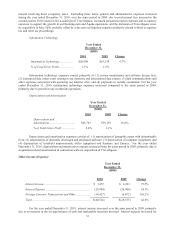
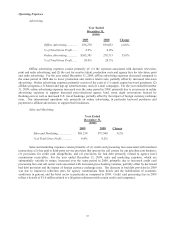
Revenues
We continue to experience a shift in the mix of our travel business from a business historically focused
exclusively on the sale of domestic point-of-sale travel services to a business that includes significant sales of
international point-of-sale hotel services, a significant majority of which are currently generated in Europe. Because
our domestic services include merchant Name Your Own Price® travel services, which are reported on a “gross”
basis, while both our domestic and international retail travel services are primarily recorded on a “net” basis,
revenue increases and decreases are impacted by changes in the mix of the sale of Name Your Own Price® and retail
travel services and, consequently, gross profit has become an increasingly important measure of evaluating growth
in our business. Our international operations contributed approximately $852.0 million to our revenues for the year
ended December 31, 2009, which compares to $619.8 million for the same period in 2008. Revenue attributable to
our international operations increased, on a local currency basis, by approximately 46% in the year ended December
31, 2009, compared to the same period in 2008.
Year Ended
December 31,
($000)
2009 2008 Change
Merchant Revenues ..................
.
$1,447,576 $1,218,162 18.8%
Agency Revenues ......................
.
868,395 648,792 33.8%
Other Revenues ........................
.
22,241 17,852 24.6%
Total Revenues .........................
.
$2,338,212 $1,884,806 24.1%
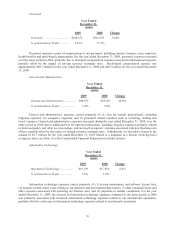
Merchant Revenues
Merchant revenues for the year ended December 31, 2009 increased 18.8%, compared to the same period in
2008, primarily due to an increase in the sale of Name Your Own Price® hotel room night reservations and rental car
days, and Agoda and domestic merchant price-disclosed hotel room night reservations, partially offset by a decline
in Name Your Own Price® airline tickets.
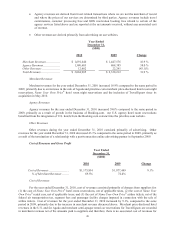
Agency Revenues
Agency revenues for the year ended December 31, 2009 increased 33.8% compared to the same period in
2008, primarily as a result of growth in our international operations.