Priceline 2010 Annual Report Download - page 52
Download and view the complete annual report
Please find page 52 of the 2010 Priceline annual report below. You can navigate through the pages in the report by either clicking on the pages listed below, or by using the keyword search tool below to find specific information within the annual report.-
 1
1 -
2
-
3
-
4
-
5
-
6
-
7
-
8
-
9
-
10
-
11
-
12
-
13
-
14
-
15
-
16
-
17
-
18
-
19
-
20
-
21
-
22
-
23
-
24
-
25
-
26
-
27
-
28
-
29
-
30
-
31
-
32
-
33
-
34
-
35
-
36
-
37
-
38
-
39
-
40
-
41
-
 42
42 -
 43
43 -
 44
44 -
 45
45 -
 46
46 -
 47
47 -
 48
48 -
 49
49 -
 50
50 -
 51
51 -
 52
52 -
 53
53 -
 54
54 -
 55
55 -
 56
56 -
 57
57 -
 58
58 -
 59
59 -
 60
60 -
 61
61 -
 62
62 -
63
-
64
-
65
-
66
-
67
-
68
-
69
-
70
-
71
-
72
-
73
-
74
-
75
-
76
-
77
-
78
-
79
-
80
-
81
-
82
-
83
-
84
-
85
-
86
-
87
-
88
-
89
-
90
-
91
-
92
-
93
-
94
-
95
-
96
-
97
-
98
-
99
-
100
-
101
-
102
-
103
-
104
-
105
-
106
-
107
-
108
-
109
-
110
-
111
-
112
-
113
-
114
-
115
-
116
-
117
-
118
-
119
-
120
-
121
-
122
-
123
-
124
-
125
-
126
-
127
-
128
-
129
-
130
-
131
-
132
-
133
-
134
-
135
-
136
-
137
-
138
-
139
-
140
-
141
-
142
-
143
-
144
-
145
-
146
-
147
-
148
-
149
-
150
-
151
-
152
-
153
-
154
-
155
-
156
-
157
-
158
-
159
-
160
-
161
-
162
-
163
-
164
-
165
-
166
-
167
-
168
-
169
-
170
-
171
-
172
-
173
-
174
-
175
-
176
-
177
-
178
-
179
-
180
-
181
-
182
-
183
-
184
-
185
-
186
-
187
-
188
-
189
-
190
-
191
-
192
-
193
-
194
-
195
-
196
-
197
-
198
-
199
-
200
 |
 |

50
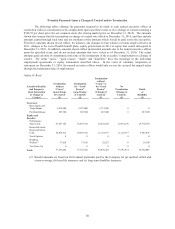
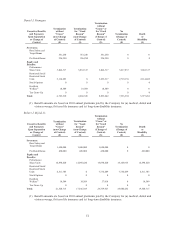
Potential Payments Upon a Change of Control and/or Termination
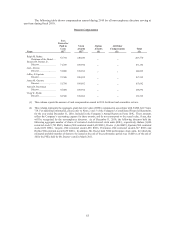
The following tables estimate the payments required to be made to each named executive officer in
connection with (a) a termination of his employment upon specified events or (b) a change of control assuming a
$399.55 per share price for our common stock (the closing market price on December 31, 2010). The amounts
shown also assume that the termination or change of control was effective December 31, 2010, and thus include
amounts earned through such time and are estimates of the amounts which would be paid out to the executives.
Therefore, amounts shown do not reflect, for instance, any changes to base salaries or bonus targets effective in
2011, changes in the cost of health benefit plans, equity grants made in 2011 or equity that vested subsequent to
December 31, 2010. In addition, amounts shown reflect incremental amounts due to the named executive officer
upon the specified event, and do not include amounts that were vested as of December 31, 2010. The actual
amounts paid can only be determined at the time of the termination of the executive’s employment or a change of
control. The terms “cause,” “good reason,” “death” and “disability” have the meanings in the individual
employment agreements or equity instruments described above. In the event of voluntary resignation or
retirement on December 31, 2010, the named executive officer would only receive his accrued but unpaid salary
through the termination date of employment.
Jeffery H. Boyd
Executive Benefits
and Payments
Upon Separation
or Change of
Control
Termination
without
“Cause”
(non-Change
of Control)
($)
Termination
for “Good
Reason”
(non-Change
of Control)
($)
Termination
without
“Cause” or
for “Good
Reason”
(Change of
Control)
($)
No
Termination
(Change of
Control)
($)
Death
or
Disability
($)
Severance:
Base Salary and
Target Bonus
2,475,000
2,475,000 3,712,500 0 0
Pro Rated Bonus 687,500 687,500 687,500 0 687,500
Equity and
Benefits:
Performance
Share Units
23,487,352 23,487,352 29,282,220 22,674,196 19,370,184
Restricted Stock/
Restricted Stock
Units
10,469,412 10,469,412 11,118,677 11,118,677 6,485,895
Stock Options 0 0 0 0 0
Health &
Welfare(1)
37,018 37,018 55,527 0 18,509
Tax Gross-Up 0 0 0 0 0
Total: 37,156,282 37,156,282 44,856,425 33,792,874 26,562,088
(1) Benefit amounts are based on 2010 annual premiums paid by the Company for (a) medical, dental and
vision coverage, (b) term life insurance and (c) long-term disability insurance.