Priceline 2010 Annual Report Download - page 112
Download and view the complete annual report
Please find page 112 of the 2010 Priceline annual report below. You can navigate through the pages in the report by either clicking on the pages listed below, or by using the keyword search tool below to find specific information within the annual report.-
 1
1 -
2
-
3
-
4
-
5
-
6
-
7
-
8
-
9
-
10
-
11
-
12
-
13
-
14
-
15
-
16
-
17
-
18
-
19
-
20
-
21
-
22
-
23
-
24
-
25
-
26
-
27
-
28
-
29
-
30
-
31
-
32
-
33
-
34
-
35
-
36
-
37
-
38
-
39
-
40
-
41
-
42
-
43
-
44
-
45
-
46
-
47
-
48
-
49
-
50
-
51
-
52
-
53
-
54
-
55
-
56
-
57
-
58
-
59
-
60
-
61
-
62
-
63
-
64
-
65
-
66
-
67
-
68
-
69
-
70
-
71
-
72
-
73
-
74
-
75
-
76
-
77
-
78
-
79
-
80
-
81
-
82
-
83
-
84
-
85
-
86
-
87
-
88
-
89
-
90
-
91
-
92
-
93
-
94
-
95
-
96
-
97
-
98
-
99
-
100
-
101
-
 102
102 -
 103
103 -
 104
104 -
 105
105 -
 106
106 -
 107
107 -
 108
108 -
 109
109 -
 110
110 -
 111
111 -
 112
112 -
 113
113 -
 114
114 -
 115
115 -
 116
116 -
 117
117 -
 118
118 -
 119
119 -
 120
120 -
 121
121 -
 122
122 -
123
-
124
-
125
-
126
-
127
-
128
-
129
-
130
-
131
-
132
-
133
-
134
-
135
-
136
-
137
-
138
-
139
-
140
-
141
-
142
-
143
-
144
-
145
-
146
-
147
-
148
-
149
-
150
-
151
-
152
-
153
-
154
-
155
-
156
-
157
-
158
-
159
-
160
-
161
-
162
-
163
-
164
-
165
-
166
-
167
-
168
-
169
-
170
-
171
-
172
-
173
-
174
-
175
-
176
-
177
-
178
-
179
-
180
-
181
-
182
-
183
-
184
-
185
-
186
-
187
-
188
-
189
-
190
-
191
-
192
-
193
-
194
-
195
-
196
-
197
-
198
-
199
-
200
 |
 |
38
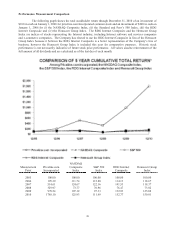
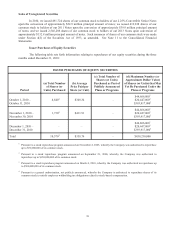
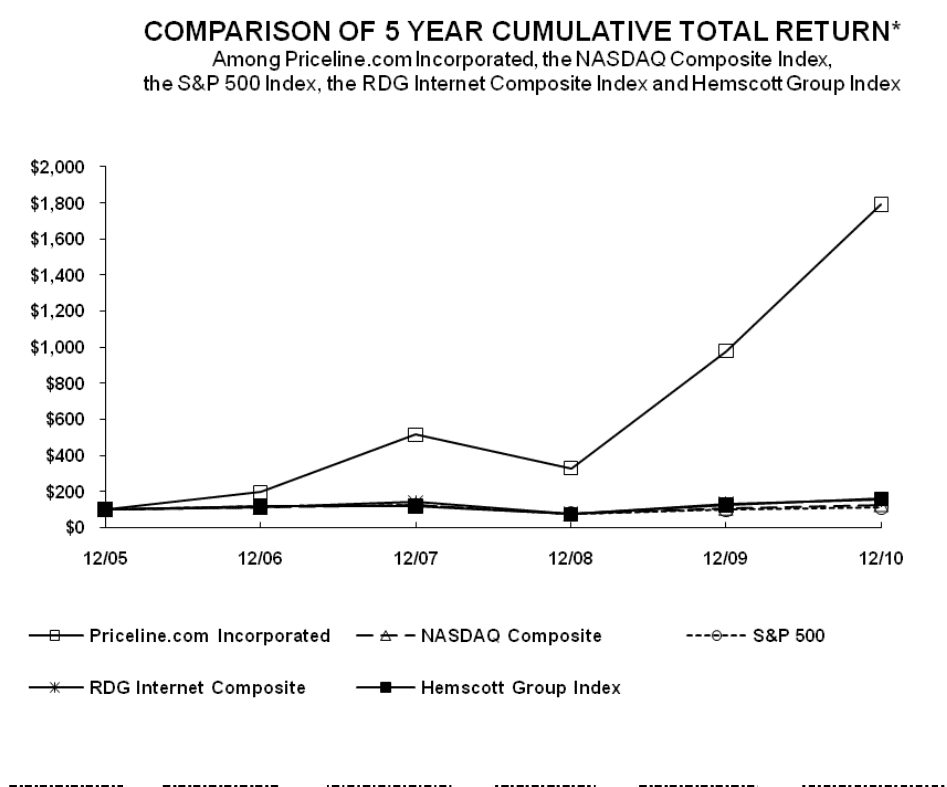
Performance Measurement Comparison
The following graph shows the total stockholder return through December 31, 2010 of an investment of
$100 in cash on January 1, 2006 for priceline.com Incorporated common stock and an investment of $100 in cash on
January 1, 2006 for (i) the NASDAQ Composite Index, (ii) the Standard and Poor’s 500 Index, (iii) the RDG
Internet Composite and (iv) the Hemscott Group Index. The RDG Internet Composite and the Hemscott Group
Index are indices of stocks representing the Internet industry, including Internet software and services companies
and e-commerce companies. The Company has elected to use the RDG Internet Composite in lieu of the Hemscott
Group Index because it believes the RDG Internet Composite is a better representation of the Company’s line of
business, however the Hemscott Group Index is included this year for comparative purposes. Historic stock
performance is not necessarily indicative of future stock price performance. All values assume reinvestment of the
full amount of all dividends and are calculated as of the last day of each month:
Measurement
Point
Priceline.com
Incorporated
NASDAQ
Composite
Index
S&P 500
Index
RDG Internet
Composite
Hemscott Group
Index
2005 100.00 100.00 100.00 100.00 100.00
2006 195.39 111.74 115.80 114.13 118.67
2007 514.61 124.67 122.16 141.53 118.37
2008 329.97 73.77 76.96 76.47 73.82
2009 978.54 107.12 97.33 132.93 125.08
2010 1790.10 125.93 111.99 152.77 159.81