Priceline 2010 Annual Report Download - page 131
Download and view the complete annual report
Please find page 131 of the 2010 Priceline annual report below. You can navigate through the pages in the report by either clicking on the pages listed below, or by using the keyword search tool below to find specific information within the annual report.
57
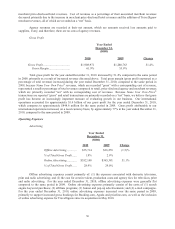
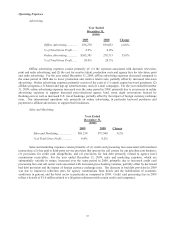
Operating Expenses
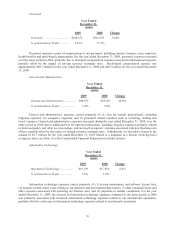
Advertising
Year Ended
December 31,
($000)
2009 2008 Change
Offline Advertising .............
.
$36,270 $38,032 (4.6)%
% of Total Gross Profit ......
.
2.9% 4.0%
Online Advertising ..............
.
$365,381 270,713 35.0%
% of Total Gross Profit ......
.
29.0% 28.3%
Offline advertising expenses consist primarily of: (1) the expenses associated with domestic television,
print and radio advertising; and (2) the cost for creative talent, production costs and agency fees for television, print
and radio advertising. For the year ended December 31, 2009, offline advertising expenses decreased compared to
the same period in 2008 due to lower production and creative talent costs, partially offset by increased television
advertising. Online advertising expenses primarily consist of the costs of (1) search engine keyword purchases; (2)
affiliate programs; (3) banner and pop-up advertisements; and (4) e-mail campaigns. For the year ended December
31, 2009, online advertising expenses increased over the same period in 2008, primarily due to an increase in online
advertising expenses to support increased price-disclosed agency hotel room night reservations booked by
Booking.com as well as increased U.S. travel bookings, partially offset by the impact of foreign currency exchange
rates. Our international operations rely primarily on online advertising, in particular keyword purchases and
payments to affiliate advertisers, to support their businesses.
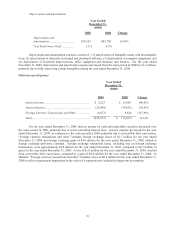
Sales and Marketing
Year Ended
December 31,
($000)
2009 2008 Change
Sales and Marketing .................. $81,238 $77,948 4.2%
% of Total Gross Profit ............. 6.4% 8.2%
Sales and marketing expenses consist primarily of (1) credit card processing fees associated with merchant
transactions; (2) fees paid to third-party service providers that operate the call centers for our priceline.com business;
(3) provisions for credit card chargebacks; and (4) provisions for bad debt primarily related to agency hotel
commission receivables. For the year ended December 31, 2009, sales and marketing expenses, which are
substantially variable in nature, increased over the same period in 2008, primarily due to increased credit card
processing fees and call center costs associated with increased gross booking volumes, partially offset by decreased
bad debt provision and the impact of foreign currency exchange rates. The decrease in bad debt provision in 2009
was due to improved collection rates for agency commissions from hotels and the stabilization of economic
conditions in general, and the hotel sector in particular as compared to 2008. Credit card processing fees in 2009
reflect a benefit of $1.0 million related to a litigation settlement with certain credit card companies.


