Priceline 2010 Annual Report Download - page 133
Download and view the complete annual report
Please find page 133 of the 2010 Priceline annual report below. You can navigate through the pages in the report by either clicking on the pages listed below, or by using the keyword search tool below to find specific information within the annual report.-
 1
1 -
2
-
3
-
4
-
5
-
6
-
7
-
8
-
9
-
10
-
11
-
12
-
13
-
14
-
15
-
16
-
17
-
18
-
19
-
20
-
21
-
22
-
23
-
24
-
25
-
26
-
27
-
28
-
29
-
30
-
31
-
32
-
33
-
34
-
35
-
36
-
37
-
38
-
39
-
40
-
41
-
42
-
43
-
44
-
45
-
46
-
47
-
48
-
49
-
50
-
51
-
52
-
53
-
54
-
55
-
56
-
57
-
58
-
59
-
60
-
61
-
62
-
63
-
64
-
65
-
66
-
67
-
68
-
69
-
70
-
71
-
72
-
73
-
74
-
75
-
76
-
77
-
78
-
79
-
80
-
81
-
82
-
83
-
84
-
85
-
86
-
87
-
88
-
89
-
90
-
91
-
92
-
93
-
94
-
95
-
96
-
97
-
98
-
99
-
100
-
101
-
102
-
103
-
104
-
105
-
106
-
107
-
108
-
109
-
110
-
111
-
112
-
113
-
114
-
115
-
116
-
117
-
118
-
119
-
120
-
121
-
122
-
 123
123 -
 124
124 -
 125
125 -
 126
126 -
 127
127 -
 128
128 -
 129
129 -
 130
130 -
 131
131 -
 132
132 -
 133
133 -
 134
134 -
 135
135 -
 136
136 -
 137
137 -
 138
138 -
 139
139 -
 140
140 -
 141
141 -
 142
142 -
 143
143 -
144
-
145
-
146
-
147
-
148
-
149
-
150
-
151
-
152
-
153
-
154
-
155
-
156
-
157
-
158
-
159
-
160
-
161
-
162
-
163
-
164
-
165
-
166
-
167
-
168
-
169
-
170
-
171
-
172
-
173
-
174
-
175
-
176
-
177
-
178
-
179
-
180
-
181
-
182
-
183
-
184
-
185
-
186
-
187
-
188
-
189
-
190
-
191
-
192
-
193
-
194
-
195
-
196
-
197
-
198
-
199
-
200
 |
 |

59
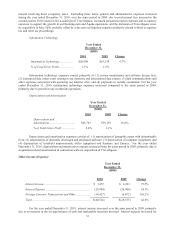
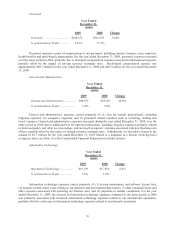
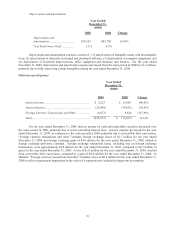
Depreciation and Amortization
Year Ended
December 31,
($000)
2009 2008 Change
Depreciation and
Amortization ...................................
$39,193
$42,796
(8.4)%
% of Total Gross Profit .................. 3.1% 4.5%
Depreciation and amortization expenses consist of: (1) amortization of intangible assets with determinable
lives; (2) amortization of internally developed and purchased software, (3) depreciation of computer equipment; and
(4) depreciation of leasehold improvements, office equipment and furniture and fixtures. For the year ended
December 31, 2009, depreciation and amortization expense decreased from the same period in 2008 by $3.6 million,
primarily due to fully amortizing certain intangibles during the year ended December 31, 2008.
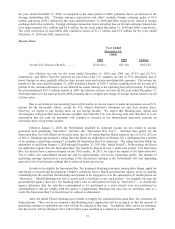
Other Income (Expense)
Year Ended
December 31,
($000)
2009
2008
Change
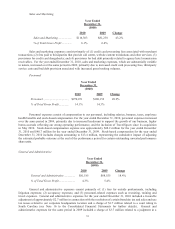
Interest Income .............................................................. $ 2,223 $ 11,660 (80.9)%
Interest Expense ............................................................ (24,084) (34,853) (30.9)%
Foreign Currency Transactions and Other ................... (6,672) 9,824 (167.9)%
Total .............................................................................. $(28,533) $ (13,369) 113.4%
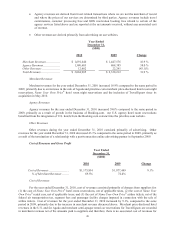
For the year ended December 31, 2009, interest income on cash and marketable securities decreased over
the same period in 2008, primarily due to lower prevailing interest rates. Interest expense decreased for the year
ended December 31, 2009, as compared to the same period in 2008, primarily due to convertible debt conversions.
“Foreign currency transactions and other” includes foreign exchange losses of $2.7 million for the year ended
December 31, 2009 and foreign exchange gains of $4.0 million for the year ended December 31, 2008, related to
foreign exchange derivative contracts. Foreign exchange transaction losses, including fees on foreign exchange
transactions, were approximately $2.9 million for the year ended December 31, 2009, compared to $0.3 million of
gains for the year ended December 31, 2008. A loss of $1.0 million for the year ended December 31, 2009, resulted
from convertible debt conversions, compared to a gain of $6.0 million for the year ended December 31, 2008. In
addition, “Foreign currency transactions and other” includes a loss of $0.8 million for the year ended December 31,
2008 to reflect a permanent impairment in the value of a corporate note included in long-term investments.