Priceline 2010 Annual Report Download - page 114
Download and view the complete annual report
Please find page 114 of the 2010 Priceline annual report below. You can navigate through the pages in the report by either clicking on the pages listed below, or by using the keyword search tool below to find specific information within the annual report.-
 1
1 -
2
-
3
-
4
-
5
-
6
-
7
-
8
-
9
-
10
-
11
-
12
-
13
-
14
-
15
-
16
-
17
-
18
-
19
-
20
-
21
-
22
-
23
-
24
-
25
-
26
-
27
-
28
-
29
-
30
-
31
-
32
-
33
-
34
-
35
-
36
-
37
-
38
-
39
-
40
-
41
-
42
-
43
-
44
-
45
-
46
-
47
-
48
-
49
-
50
-
51
-
52
-
53
-
54
-
55
-
56
-
57
-
58
-
59
-
60
-
61
-
62
-
63
-
64
-
65
-
66
-
67
-
68
-
69
-
70
-
71
-
72
-
73
-
74
-
75
-
76
-
77
-
78
-
79
-
80
-
81
-
82
-
83
-
84
-
85
-
86
-
87
-
88
-
89
-
90
-
91
-
92
-
93
-
94
-
95
-
96
-
97
-
98
-
99
-
100
-
101
-
102
-
103
-
 104
104 -
 105
105 -
 106
106 -
 107
107 -
 108
108 -
 109
109 -
 110
110 -
 111
111 -
 112
112 -
 113
113 -
 114
114 -
 115
115 -
 116
116 -
 117
117 -
 118
118 -
 119
119 -
 120
120 -
 121
121 -
 122
122 -
 123
123 -
 124
124 -
125
-
126
-
127
-
128
-
129
-
130
-
131
-
132
-
133
-
134
-
135
-
136
-
137
-
138
-
139
-
140
-
141
-
142
-
143
-
144
-
145
-
146
-
147
-
148
-
149
-
150
-
151
-
152
-
153
-
154
-
155
-
156
-
157
-
158
-
159
-
160
-
161
-
162
-
163
-
164
-
165
-
166
-
167
-
168
-
169
-
170
-
171
-
172
-
173
-
174
-
175
-
176
-
177
-
178
-
179
-
180
-
181
-
182
-
183
-
184
-
185
-
186
-
187
-
188
-
189
-
190
-
191
-
192
-
193
-
194
-
195
-
196
-
197
-
198
-
199
-
200
 |
 |

40
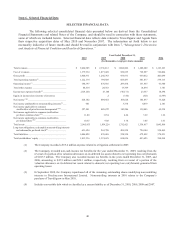
Item 6. Selected Financial Data
SELECTED FINANCIAL DATA
The following selected consolidated financial data presented below are derived from the Consolidated
Financial Statements and related Notes of the Company, and should be read in connection with those statements,
some of which are included herein. Selected financial data reflects data related to TravelJigsaw and Agoda from
their respective acquisition dates of May 2010 and November 2007. The information set forth below is not
necessarily indicative of future results and should be read in conjunction with Item 7, “Management’s Discussion
and Analysis of Financial Condition and Results of Operations.”
Year Ended December 31,
2010 2009 2008 2007 2006
(In thousands, except per share amounts)
Total revenues .................................................................. $ 3,084,905 $ 2,338,212 $ 1,884,806 $ 1,409,409 $ 1,123,103
Cost of revenues ............................................................... 1,175,934 1,077,449 928,835 769,997 722,004
Gross profit ...................................................................... 1,908,971 1,260,763 955,971 639,412 401,099
Total operating expenses(1)............................................... 1,122,174 789,928 666,497 501,477 339,113
Operating income(1) .......................................................... 786,797 470,835 289,474 137,935 61,986
Total other expense .......................................................... 40,514 28,533 13,369 16,074 1,761
Income tax (expense) benefit(2) ........................................ (218,141) 47,168 (90,171) 23,537 14,594
Equity in income (loss) income of investees - 2 (310) (321) (1,393)
Net income(1)(2) ................................................................. 528,142 489,472 185,624 145,077 73,426
Net income attributable to noncontrolling interests(3) ..... 601 - 3,378 4,679 2,161
Net income applicable to common
stockholders of priceline.com Incorporated (1)(2) ......... 527,541 489,472 182,246 138,843 69,338
Net income applicable to common stockholders
per basic common share(1)(2) ........................................ 11.00 11.54 4.64 3.69 1.86
Net income applicable to common stockholders
per diluted share(1)(2) .................................................... 10.35 9.88 3.74 3.05 1.61
Total assets ....................................................................... 2,905,953 1,834,224 1,312,421 1,334,017 1,045,509
Long-term obligations, redeemable noncontrolling interests
and redeemable preferred stock(4) ............................... 621,624 263,708 459,928 724,144 554,469
Total liabilities ................................................................. 1,046,828 476,610 538,520 672,492 578,931
Total stockholders’ equity ............................................... 1,813,336 1,321,629 698,826 453,625 390,368
(1) The Company recorded a $55.4 million expense related to a litigation settlement in 2007.
(2) The Company recorded non-cash income tax benefits for the year ended December 31, 2009, resulting from the
reversal of a portion of its valuation allowance on its deferred tax assets related to net operating loss carryforwards
of $183.3 million. The Company also recorded income tax benefits in the years ended December 31, 2007, and
2006, amounting to $47.9 million and $28.1 million, respectively, resulting from a reversal of a portion of the
valuation allowance on its deferred tax assets related to domestic net operating loss carryfowards generated from
operating losses.
(3) In September 2008, the Company repurchased all of the remaining outstanding shares underlying noncontrolling
interests in Priceline.com International Limited. Noncontrolling interests in 2010 relates to the Company’s
purchase of TravelJigsaw in May 2010.
(4) Includes convertible debt which is classified as a current liability as of December 31, 2010, 2009, 2008 and 2007.