Priceline 2010 Annual Report Download - page 171
Download and view the complete annual report
Please find page 171 of the 2010 Priceline annual report below. You can navigate through the pages in the report by either clicking on the pages listed below, or by using the keyword search tool below to find specific information within the annual report.-
 1
1 -
2
-
3
-
4
-
5
-
6
-
7
-
8
-
9
-
10
-
11
-
12
-
13
-
14
-
15
-
16
-
17
-
18
-
19
-
20
-
21
-
22
-
23
-
24
-
25
-
26
-
27
-
28
-
29
-
30
-
31
-
32
-
33
-
34
-
35
-
36
-
37
-
38
-
39
-
40
-
41
-
42
-
43
-
44
-
45
-
46
-
47
-
48
-
49
-
50
-
51
-
52
-
53
-
54
-
55
-
56
-
57
-
58
-
59
-
60
-
61
-
62
-
63
-
64
-
65
-
66
-
67
-
68
-
69
-
70
-
71
-
72
-
73
-
74
-
75
-
76
-
77
-
78
-
79
-
80
-
81
-
82
-
83
-
84
-
85
-
86
-
87
-
88
-
89
-
90
-
91
-
92
-
93
-
94
-
95
-
96
-
97
-
98
-
99
-
100
-
101
-
102
-
103
-
104
-
105
-
106
-
107
-
108
-
109
-
110
-
111
-
112
-
113
-
114
-
115
-
116
-
117
-
118
-
119
-
120
-
121
-
122
-
123
-
124
-
125
-
126
-
127
-
128
-
129
-
130
-
131
-
132
-
133
-
134
-
135
-
136
-
137
-
138
-
139
-
140
-
141
-
142
-
143
-
144
-
145
-
146
-
147
-
148
-
149
-
150
-
151
-
152
-
153
-
154
-
155
-
156
-
157
-
158
-
159
-
160
-
 161
161 -
 162
162 -
 163
163 -
 164
164 -
 165
165 -
 166
166 -
 167
167 -
 168
168 -
 169
169 -
 170
170 -
 171
171 -
 172
172 -
 173
173 -
 174
174 -
 175
175 -
 176
176 -
 177
177 -
 178
178 -
 179
179 -
 180
180 -
 181
181 -
182
-
183
-
184
-
185
-
186
-
187
-
188
-
189
-
190
-
191
-
192
-
193
-
194
-
195
-
196
-
197
-
198
-
199
-
200
 |
 |

97
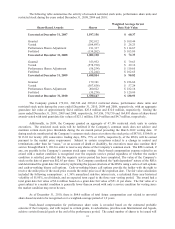
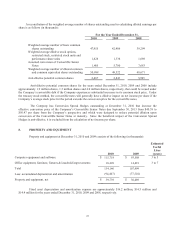
A reconciliation of the weighted average number of shares outstanding used in calculating diluted earnings per
share is as follows (in thousands):
For the Year Ended December 31,
2010 2009 2008
Weighted average number of basic common
shares outstanding
47,955
42,406
39,299
Weighted average dilutive stock options,
restricted stock, restricted stock units and
performance share units 1,628
1,336
1,689
Assumed conversion of Convertible Senior
Notes 1,405
5,780
7,683
Weighted average number of diluted common
and common equivalent shares outstanding 50,988
49,522
48,671
Anti-dilutive potential common shares 2,487 2,843 5,905
Anti-dilutive potential common shares for the years ended December 31, 2010, 2009 and 2008 include
approximately 1.9 million shares, 1.5 million shares and 4.0 million shares, respectively, that could be issued under
the Company’s convertible debt if the Company experiences substantial increases in its common stock price. Under
the treasury stock method, the convertible notes will generally have a dilutive impact on net income per share if the
Company’s average stock price for the period exceeds the conversion price for the convertible notes.
The Company has Conversion Spread Hedges outstanding at December 31, 2010 that increase the
effective conversion price of the Company’s Convertible Senior Notes due September 30, 2013 from $40.38 to
$50.47 per share from the Company’s perspective and which were designed to reduce potential dilution upon
conversion of the Convertible Senior Notes at maturity. Since the beneficial impact of the Conversion Spread
Hedges is anti-dilutive, it is excluded from the calculation of net income per share.
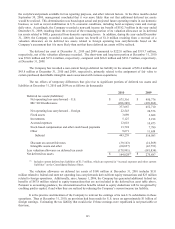
8. PROPERTY AND EQUIPMENT
Property and equipment at December 31, 2010 and 2009 consists of the following (in thousands):
2010
2009
Estimated
Useful
Lives
(years)
Computer equipment and software $ 115,718 $ 93,508 3 to 5
Office equipment, furniture, fixtures & leasehold improvements 18,428 14,491 3 to 7
Total
134,146 107,999
Less: accumulated depreciation and amortization (94,407) (77,510)
Property and equipment, net $ 39,739 $ 30,489
Fixed asset depreciation and amortization expense are approximately $16.2 million, $14.5 million and
$14.4 million for the years ended December 31, 2010, 2009 and 2008, respectively.