Priceline 2010 Annual Report Download - page 43
Download and view the complete annual report
Please find page 43 of the 2010 Priceline annual report below. You can navigate through the pages in the report by either clicking on the pages listed below, or by using the keyword search tool below to find specific information within the annual report.-
 1
1 -
2
-
3
-
4
-
5
-
6
-
7
-
8
-
9
-
10
-
11
-
12
-
13
-
14
-
15
-
16
-
17
-
18
-
19
-
20
-
21
-
22
-
23
-
24
-
25
-
26
-
27
-
28
-
29
-
30
-
31
-
32
-
 33
33 -
 34
34 -
 35
35 -
 36
36 -
 37
37 -
 38
38 -
 39
39 -
 40
40 -
 41
41 -
 42
42 -
 43
43 -
 44
44 -
 45
45 -
 46
46 -
 47
47 -
 48
48 -
 49
49 -
 50
50 -
 51
51 -
 52
52 -
 53
53 -
54
-
55
-
56
-
57
-
58
-
59
-
60
-
61
-
62
-
63
-
64
-
65
-
66
-
67
-
68
-
69
-
70
-
71
-
72
-
73
-
74
-
75
-
76
-
77
-
78
-
79
-
80
-
81
-
82
-
83
-
84
-
85
-
86
-
87
-
88
-
89
-
90
-
91
-
92
-
93
-
94
-
95
-
96
-
97
-
98
-
99
-
100
-
101
-
102
-
103
-
104
-
105
-
106
-
107
-
108
-
109
-
110
-
111
-
112
-
113
-
114
-
115
-
116
-
117
-
118
-
119
-
120
-
121
-
122
-
123
-
124
-
125
-
126
-
127
-
128
-
129
-
130
-
131
-
132
-
133
-
134
-
135
-
136
-
137
-
138
-
139
-
140
-
141
-
142
-
143
-
144
-
145
-
146
-
147
-
148
-
149
-
150
-
151
-
152
-
153
-
154
-
155
-
156
-
157
-
158
-
159
-
160
-
161
-
162
-
163
-
164
-
165
-
166
-
167
-
168
-
169
-
170
-
171
-
172
-
173
-
174
-
175
-
176
-
177
-
178
-
179
-
180
-
181
-
182
-
183
-
184
-
185
-
186
-
187
-
188
-
189
-
190
-
191
-
192
-
193
-
194
-
195
-
196
-
197
-
198
-
199
-
200
 |
 |

41
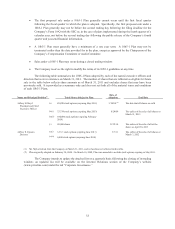
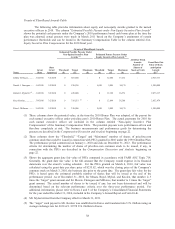
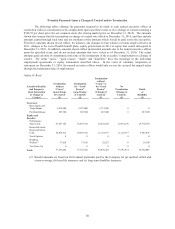
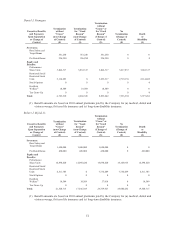
Option Exercises and Stock Vested Table
The following table contains information about stock options exercised by the named executive officers
and the vesting of stock awards held by the named executive officers in 2010.
Option Exercises and Stock Vested
Option Awards Stock Awards
Name
Number of
Shares Ac
q
uired
on Exercise
(#)(1)
Value Realized
on Exercise
($)(2)
Number of
Shares Ac
q
uired
on Vesting
(#)
Value Realized
on Vesting
($)
Jeffery H. Boyd .....................................
.
155,554 30,240,174 66,000(3) 15,385,920
Daniel J. Finnegan. ................................
.
0 0 7,500(4) 1,748,400
Robert J. Mylod Jr. ................................
.
55,499 14,256,759 46,000(5) 10,723,520
Kees Koolen ..........................................
.
0 0 7,000(6) 1,631,840
Peter J. Millones ....................................
.
0 0 12,500(7) 2,914,000
(1) This column represents the number of shares underlying stock options exercised.
(2) This column reflects the difference between the per share market value of priceline.com common stock at
each exercise and the per share exercise price of the stock options exercised, multiplied, in each case, by
the number of stock options exercised.
(3) Mr. Boyd acquired 66,000 shares with a per share market price of $233.12 in March 2010 upon the vesting
of performance share units.
(4) Mr. Finnegan acquired 7,500 shares with a per share market price of $233.12 in March 2010 upon the
vesting of 4,500 shares of restricted stock and 3,000 performance share units.
(5) Mr. Mylod acquired 46,000 shares with a per share market price of $233.12 in March 2010 upon the
vesting of performance share units.
(6) Mr. Koolen acquired 7,000 shares with a per share market price of $233.12 in March 2010 upon the vesting
of restricted stock units.
(7) Mr. Millones acquired 12,500 shares with a per share market price of $233.12 in March 2010 upon the
vesting of 7,500 shares of restricted stock and 5,000 performance share units.