Priceline 2010 Annual Report Download - page 28
Download and view the complete annual report
Please find page 28 of the 2010 Priceline annual report below. You can navigate through the pages in the report by either clicking on the pages listed below, or by using the keyword search tool below to find specific information within the annual report.-
 1
1 -
2
-
3
-
4
-
5
-
6
-
7
-
8
-
9
-
10
-
11
-
12
-
13
-
14
-
15
-
16
-
17
-
 18
18 -
 19
19 -
 20
20 -
 21
21 -
 22
22 -
 23
23 -
 24
24 -
 25
25 -
 26
26 -
 27
27 -
 28
28 -
 29
29 -
 30
30 -
 31
31 -
 32
32 -
 33
33 -
 34
34 -
 35
35 -
 36
36 -
 37
37 -
 38
38 -
39
-
40
-
41
-
42
-
43
-
44
-
45
-
46
-
47
-
48
-
49
-
50
-
51
-
52
-
53
-
54
-
55
-
56
-
57
-
58
-
59
-
60
-
61
-
62
-
63
-
64
-
65
-
66
-
67
-
68
-
69
-
70
-
71
-
72
-
73
-
74
-
75
-
76
-
77
-
78
-
79
-
80
-
81
-
82
-
83
-
84
-
85
-
86
-
87
-
88
-
89
-
90
-
91
-
92
-
93
-
94
-
95
-
96
-
97
-
98
-
99
-
100
-
101
-
102
-
103
-
104
-
105
-
106
-
107
-
108
-
109
-
110
-
111
-
112
-
113
-
114
-
115
-
116
-
117
-
118
-
119
-
120
-
121
-
122
-
123
-
124
-
125
-
126
-
127
-
128
-
129
-
130
-
131
-
132
-
133
-
134
-
135
-
136
-
137
-
138
-
139
-
140
-
141
-
142
-
143
-
144
-
145
-
146
-
147
-
148
-
149
-
150
-
151
-
152
-
153
-
154
-
155
-
156
-
157
-
158
-
159
-
160
-
161
-
162
-
163
-
164
-
165
-
166
-
167
-
168
-
169
-
170
-
171
-
172
-
173
-
174
-
175
-
176
-
177
-
178
-
179
-
180
-
181
-
182
-
183
-
184
-
185
-
186
-
187
-
188
-
189
-
190
-
191
-
192
-
193
-
194
-
195
-
196
-
197
-
198
-
199
-
200
 |
 |
26
Despite the lingering effects of the recent worldwide recession, priceline.com’s financial and
operational performance during 2010 was excellent in the Committee’s view; priceline.com’s year-over-year
consolidated pre-bonus non-GAAP EBITDA growth was more than 63%, an earnings growth rate that
significantly exceeded that of the Company’s direct competitors.
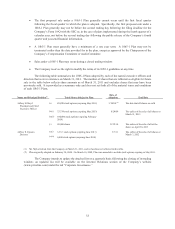
What metric was used? The 2010 Bonus Plan was based upon the accomplishment of certain non-
GAAP EBITDA targets. For purposes of the plan, EBITDA is operating income before interest, tax,
depreciation and amortization expense and, for purposes of calculating EBITDA on a consolidated basis,
includes foreign currency transactions and other. Non-GAAP EBITDA excludes stock based compensation
expense and other items which, in the sole judgment of the Committee, are generally “non-cash,” “one time” or
“non-recurring” in nature, whether favorable or unfavorable. For Booking.com, the non-GAAP EBITDA targets
were denominated in Euros.
These adjustments to EBITDA under the 2010 Bonus Plan are generally consistent with the adjustments
made by priceline.com in the calculation of non-GAAP EBITDA used in the Company’s quarterly and annual
earnings announcements and referenced by many of the financial analysts that follow priceline.com. The
adjustments are intended to ensure that any payments under the 2010 Bonus Plan represent the underlying
growth of priceline.com’s core business and are not inflated or deflated due to “non-cash,” “one time” or “non-
recurring” items. This measure is effective as it focuses employees on the Company’s core earnings so that they
can be directly rewarded for business growth and productivity improvements. This measure is also an effective
motivator because it is relatively easy to track and generally understood by employees.
How did the 2010 Bonus Plan work? The sole determinant of the funding of the 2010 Bonus Plan was
the accomplishment of certain pre-bonus non-GAAP EBITDA targets. The 2010 Bonus Plan was composed of
different “sub” pools - one of which was based on priceline.com’s consolidated non-GAAP EBITDA, in which
all of the named executive officers other than Mr. Koolen participated, and one based on Booking.com’s non-
GAAP EBITDA, in which Mr. Koolen participated. Both of the 2010 bonus “sub” pools funded throughout
2010 as priceline.com met and/or exceeded the respective, pre-established non-GAAP EBITDA targets, which
targets are higher for executives than for lower level employees.
Bonus pools under the 2010 Bonus Plan were designed to fund as follows:
x In order for the Booking.com B.V. 2010 bonus pool to be funded at a level equal to that of the previous
year, Booking.com B.V. needed to achieve 2010 year-over-year pre-bonus non-GAAP EBITDA growth
of 24%. On the other hand, if Booking.com B.V.’s year-over-year pre-bonus non-GAAP EBITDA
growth was 15%, which the Committee estimated at the time the bonus pools were established would
approximate “market” growth, the Booking.com 2010 bonus pool would be funded at a level that would
have represented an approximately 49% year-over-year decrease in the Booking.com bonus pool.
x In order for the “consolidated” senior executive bonus pool to be funded at a level equal to that of the
previous year, priceline.com needed to achieve 2010 year-over-year pre-bonus non-GAAP
“consolidated” EBITDA growth of 26%. If “consolidated” pre-bonus non-GAAP EBITDA growth was
10%, which the Committee estimated at the time the bonus pools were established would approximate
“market” growth, the bonus pool for senior executive officers would be funded at a level that would
have represented an approximately 83% year-over-year decrease in the senior executive bonus pool for
senior executives that participated in the consolidated pool.
As the growth targets above illustrate, significant funding of the 2010 Bonus Pool for the Company’s
named executive officers would only occur upon the achievement by the Company of significant double-digit-
year-over-year earnings growth.
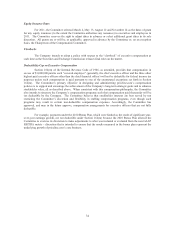
Individual Bonus Targets. Bonus targets for the named executive officers were based on job
responsibilities, internal relativity, and data for the Compensation Peer Group. Consistent with our executive
compensation policy, individuals with greater job responsibilities had a greater proportion of their total cash
compensation tied to priceline.com’s performance through the 2010 Bonus Plan. The Committee established
bonus targets for 2010 (expressed as a percentage of annual base salary) for the named executive officers ranging
from 50% to 200%. The Committee reserved the right in its complete discretion to decrease or increase payouts