Priceline 2010 Annual Report Download - page 135
Download and view the complete annual report
Please find page 135 of the 2010 Priceline annual report below. You can navigate through the pages in the report by either clicking on the pages listed below, or by using the keyword search tool below to find specific information within the annual report.61
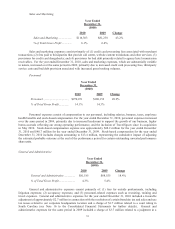
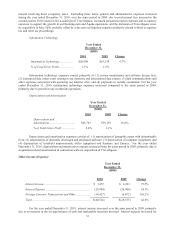
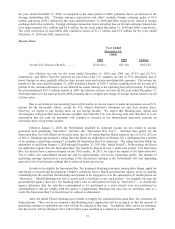
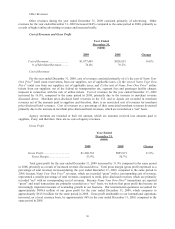
Liquidity and Capital Resources
As of December 31, 2010, we had $1.7 billion in cash, cash equivalents and short-term investments.
Approximately $949 million of our cash, cash equivalents and short-term investments are held by our international
subsidiaries and are denominated primarily in Euros and, to a lesser extent, in British Pound Sterling. We currently
intend to permanently reinvest this cash in our foreign operations. We could not repatriate this cash to the U.S.
without incurring additional tax payments in the U.S. Cash equivalents and short-term investments are primarily
comprised of foreign and U.S. government securities and bank deposits.
In March 2010, we issued in a private placement $575.0 million aggregate principal amount of convertible
senior notes due 2015, with an interest rate of 1.25%. Interest on these notes is payable in March and September of
each year. The net proceeds may be used for general corporate purposes, which may include repurchasing shares of
priceline.com Incorporated common stock from time to time, repaying outstanding debt and corporate acquisitions.
As discussed below, concurrent with this debt offering, we repurchased approximately $100 million of our
outstanding common stock. See Note 11 to the Consolidated Financial Statements for further details on these notes.
In March 2010, our Board of Directors authorized an additional repurchase of up to $500 million of our
common stock from time to time in open market or privately negotiated transactions, including the approval to
purchase up to $100 million of our common stock from the proceeds of, and concurrently with, the offering of the
notes discussed above. We repurchased 461,437 shares of our common stock at an aggregate cost of $106.1 million
during the year ended December 31, 2010. As of December 31, 2010, we have a remaining authorization to
repurchase $459.2 million of our common stock. We may from time to time make additional repurchases of our
common stock, depending on prevailing market conditions, alternate uses of capital and other factors.
Our merchant transactions are structured such that we collect cash up front from our customers and then we
pay most of our suppliers at a subsequent date. We therefore tend to experience significant swings in supplier
payables depending on the volume of our business during the last few weeks of every quarter. This can cause
volatility in working capital levels and impact cash balances more or less than our operating income would indicate.
Net cash provided by operating activities for the year ended December 31, 2010, was $777.3 million,
resulting from net income of $528.1 million and net favorable changes in working capital of $50.9 million, and a net
favorable impact of $198.3 million for non-cash items not affecting cash flows. Non-cash items include deferred
income taxes, stock-based compensation expense, depreciation and amortization, primarily from acquisition-related
intangible assets, amortization of debt discount and loss on conversions of our convertible notes. For the year ended
December 31, 2010, accounts payable, accrued expenses and other current liabilities increased by $84.8 million,
primarily related to higher deferred merchant bookings and accrued expenses as our business continues to expand.
Other changes in working capital for the year ended December 31, 2010 include an increase in other assets and
liabilities of $17.8 million, principally related to an increase in long-term liabilities, partially offset by a $29.3
million increase in accounts receivable, and a $22.4 million increase in prepaid expenses and other current assets.
The increase in accounts receivable is primarily due to the growth in the size of our business. The increase in
prepaid expenses and other current assets is primarily related to the timing and amount of tax payments and
increases in business volume.
Net cash provided by operating activities for the year ended December 31, 2009, was $509.7 million,
resulting from net income of $489.5 million and net favorable changes in working capital of $67.7 million, partially
offset by a net unfavorable impact of $47.5 million for non-cash items not affecting cash flows. Non-cash items
include the benefit of $183.3 million from the reversal of a portion of the valuation allowance on our deferred tax
assets, stock-based compensation expense, depreciation and amortization, primarily from acquisition-related
intangible assets, amortization of debt discount and loss on conversions of our convertible notes. The changes in
working capital for the year ended December 31, 2009, were related to an $86.8 million increase in accounts
payable, accrued expenses and other current liabilities, partially offset by a $22.8 million increase in accounts
receivable. The increase in these working capital balances was primarily related to increases in business volume.
Net cash used in investing activities was $841.1 million for the year ended December 31, 2010. Investing
activities were affected by $741.4 million net purchase of marketable securities and a payment of $112.4 million for
acquisitions and other equity investments, net of cash acquired, partially offset by $35.0 million net proceeds from
foreign currency forward contracts and a $0.3 million change in restricted cash. Net cash used in investing activities
was $501.5 million for the year ended December 31, 2009. Investing activities were affected by $490.0 million net
purchase of marketable securities, payment of $5.0 million to settle derivative contracts and a payment of $1.5


