Priceline 2010 Annual Report Download - page 124
Download and view the complete annual report
Please find page 124 of the 2010 Priceline annual report below. You can navigate through the pages in the report by either clicking on the pages listed below, or by using the keyword search tool below to find specific information within the annual report.-
 1
1 -
2
-
3
-
4
-
5
-
6
-
7
-
8
-
9
-
10
-
11
-
12
-
13
-
14
-
15
-
16
-
17
-
18
-
19
-
20
-
21
-
22
-
23
-
24
-
25
-
26
-
27
-
28
-
29
-
30
-
31
-
32
-
33
-
34
-
35
-
36
-
37
-
38
-
39
-
40
-
41
-
42
-
43
-
44
-
45
-
46
-
47
-
48
-
49
-
50
-
51
-
52
-
53
-
54
-
55
-
56
-
57
-
58
-
59
-
60
-
61
-
62
-
63
-
64
-
65
-
66
-
67
-
68
-
69
-
70
-
71
-
72
-
73
-
74
-
75
-
76
-
77
-
78
-
79
-
80
-
81
-
82
-
83
-
84
-
85
-
86
-
87
-
88
-
89
-
90
-
91
-
92
-
93
-
94
-
95
-
96
-
97
-
98
-
99
-
100
-
101
-
102
-
103
-
104
-
105
-
106
-
107
-
108
-
109
-
110
-
111
-
112
-
113
-
 114
114 -
 115
115 -
 116
116 -
 117
117 -
 118
118 -
 119
119 -
 120
120 -
 121
121 -
 122
122 -
 123
123 -
 124
124 -
 125
125 -
 126
126 -
 127
127 -
 128
128 -
 129
129 -
 130
130 -
 131
131 -
 132
132 -
 133
133 -
 134
134 -
135
-
136
-
137
-
138
-
139
-
140
-
141
-
142
-
143
-
144
-
145
-
146
-
147
-
148
-
149
-
150
-
151
-
152
-
153
-
154
-
155
-
156
-
157
-
158
-
159
-
160
-
161
-
162
-
163
-
164
-
165
-
166
-
167
-
168
-
169
-
170
-
171
-
172
-
173
-
174
-
175
-
176
-
177
-
178
-
179
-
180
-
181
-
182
-
183
-
184
-
185
-
186
-
187
-
188
-
189
-
190
-
191
-
192
-
193
-
194
-
195
-
196
-
197
-
198
-
199
-
200
 |
 |

50
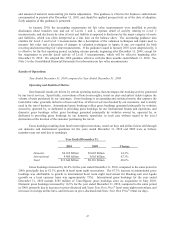
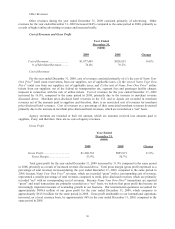
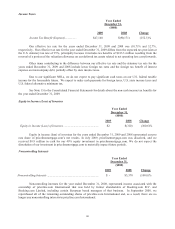
merchant price-disclosed hotel revenues. Cost of revenues as a percentage of their associated merchant revenues
decreased primarily due to the increase in merchant price-disclosed hotel revenues and the addition of TravelJigsaw
merchant revenues, all of which are recorded on a “net” basis.
Agency revenues are recorded at their net amount, which are amounts received less amounts paid to
suppliers, if any, and therefore, there are no costs of agency revenues.
Gross Profit
Year Ended
December 31,
($000)
2010 2009 Change
Gross Profit ...................................
.
$1,908,971 $1,260,763 51.4%
Gross Margin ............................
.
61.9% 53.9%
Total gross profit for the year ended December 31, 2010 increased by 51.4% compared to the same period
in 2009, primarily as a result of increased revenue discussed above. Total gross margin (gross profit expressed as a
percentage of total revenue) increased during the year ended December 31, 2010, compared to the same period in
2009, because Name Your Own Price® revenues, which are recorded “gross” with a corresponding cost of revenue,
represented a smaller percentage of total revenues compared to retail, price-disclosed agency and merchant revenues
which are primarily recorded “net” with no corresponding cost of revenues. Because Name Your Own Price®
transactions are reported “gross” and retail transactions are primarily recorded on a “net” basis, we believe that gross
profit has become an increasingly important measure of evaluating growth in our business. Our international
operations accounted for approximately $1.4 billion of our gross profit for the year ended December 31, 2010,
which compares to approximately $848.6 million for the same period in 2009. Gross profit attributable to our
international operations increased, on a local currency basis, by approximately 77% in the year ended December 31,
2010, compared to the same period in 2009.
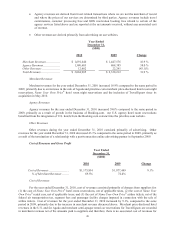
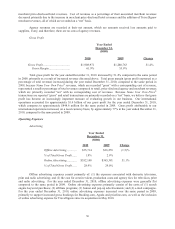
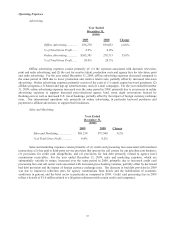
Operating Expenses
Advertising
Year Ended
December 31,
($000)
2010 2009 Change
Offline Advertising .............
.
$35,714 $36,270 (1.5)%
% of Total Gross Profit ......
.
1.9% 2.9%
Online Advertising ..............
.
$552,140 $365,381 51.1%
% of Total Gross Profit ......
.
28.9% 29.0%
Offline advertising expenses consist primarily of: (1) the expenses associated with domestic television,
print and radio advertising; and (2) the cost for creative talent, production costs and agency fees for television, print
and radio advertising. For the year ended December 31, 2010, offline advertising expenses were generally flat
compared to the same period in 2009. Online advertising expenses primarily consist of the costs of (1) search
engine keyword purchases; (2) affiliate programs; (3) banner and pop-up advertisements; and (4) e-mail campaigns.
For the year ended December 31, 2010, online advertising expenses increased over the same period in 2009,
primarily to support increased gross bookings for Booking.com, Agoda and priceline.com, as well as the inclusion
of online advertising expense for TravelJigsaw since its acquisition in May 2010.