Priceline 2010 Annual Report Download - page 179
Download and view the complete annual report
Please find page 179 of the 2010 Priceline annual report below. You can navigate through the pages in the report by either clicking on the pages listed below, or by using the keyword search tool below to find specific information within the annual report.-
 1
1 -
2
-
3
-
4
-
5
-
6
-
7
-
8
-
9
-
10
-
11
-
12
-
13
-
14
-
15
-
16
-
17
-
18
-
19
-
20
-
21
-
22
-
23
-
24
-
25
-
26
-
27
-
28
-
29
-
30
-
31
-
32
-
33
-
34
-
35
-
36
-
37
-
38
-
39
-
40
-
41
-
42
-
43
-
44
-
45
-
46
-
47
-
48
-
49
-
50
-
51
-
52
-
53
-
54
-
55
-
56
-
57
-
58
-
59
-
60
-
61
-
62
-
63
-
64
-
65
-
66
-
67
-
68
-
69
-
70
-
71
-
72
-
73
-
74
-
75
-
76
-
77
-
78
-
79
-
80
-
81
-
82
-
83
-
84
-
85
-
86
-
87
-
88
-
89
-
90
-
91
-
92
-
93
-
94
-
95
-
96
-
97
-
98
-
99
-
100
-
101
-
102
-
103
-
104
-
105
-
106
-
107
-
108
-
109
-
110
-
111
-
112
-
113
-
114
-
115
-
116
-
117
-
118
-
119
-
120
-
121
-
122
-
123
-
124
-
125
-
126
-
127
-
128
-
129
-
130
-
131
-
132
-
133
-
134
-
135
-
136
-
137
-
138
-
139
-
140
-
141
-
142
-
143
-
144
-
145
-
146
-
147
-
148
-
149
-
150
-
151
-
152
-
153
-
154
-
155
-
156
-
157
-
158
-
159
-
160
-
161
-
162
-
163
-
164
-
165
-
166
-
167
-
168
-
 169
169 -
 170
170 -
 171
171 -
 172
172 -
 173
173 -
 174
174 -
 175
175 -
 176
176 -
 177
177 -
 178
178 -
 179
179 -
 180
180 -
 181
181 -
 182
182 -
 183
183 -
 184
184 -
 185
185 -
 186
186 -
 187
187 -
 188
188 -
 189
189 -
190
-
191
-
192
-
193
-
194
-
195
-
196
-
197
-
198
-
199
-
200
 |
 |

105
the carryforward periods available for tax reporting purposes, and other relevant factors. In the three months ended
September 30, 2009, management concluded that it was more likely than not that additional deferred tax assets
would be realized. This determination was based upon actual and projected future operating results in our domestic
business, as well as recent stabilization in U.S. economic conditions, including hotel occupancy rates and average
daily rates. Accordingly, the Company recorded a non-cash income tax benefit of $182.3 million in the year ended
December 31, 2009, resulting from the reversal of the remaining portion of its valuation allowance on its deferred
tax assets related to NOLs generated from domestic operating losses. In addition, during the year ended December
31, 2009, the Company recorded a non-cash income tax benefit of $1.0 million resulting from a reversal of a
valuation allowance on its deferred tax assets related to foreign operating loss carryforwards based on the
Company’s assessment that it is more likely than not that these deferred tax assets will be realized.
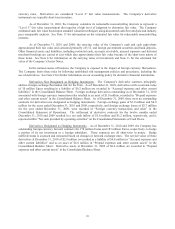
The deferred tax asset at December 31, 2010 and 2009 amounted to $222.0 million and $319.7 million,
respectively, net of the valuation allowance recorded. The short-term and long term portion at December 31, 2010
was $70.6 million and $151.4 million, respectively, compared with $66.0 million and $253.7 million, respectively,
at December 31, 2009.
The Company has recorded a non-current foreign deferred tax liability in the amount of $56.4 million and
$43.8 million at December 31, 2010 and 2009, respectively, primarily related to the assignment of fair value to
certain purchased identifiable intangible assets associated with various acquisitions.
The tax effects of temporary differences that give rise to significant portions of deferred tax assets and
liabilities at December 31, 2010 and 2009 are as follows (in thousands):
2010 2009
Deferred tax assets/(liabilities):
Net operating loss carryforward – U.S. $ 875,316 $ 950,776
IRC 382 Disallowance (498,249) (498,066)
377,067 452,710
Net operating loss carryforward – Foreign 22,543 24,576
Fixed assets 3,089 3,688
Investments 5,127 5,198
Accrued expenses 12,018
10,473
Stock-based compensation and other stock based payments 13,724
7,780
Other 9,671 11,658
Subtotal 443,239 516,083
Discount on convertible notes (39,163) (14,569)
Intangible assets and other (60,057) (43,793)
Less valuation allowance on deferred tax assets (179,991) (181,834)
Net deferred tax assets $ 164,028(1) $ 275,887
(1) Includes current deferred tax liabilities of $1.5 million, which are reported in “Accrued expenses and other current
liabilities” on the Consolidated Balance Sheet.
The valuation allowance on deferred tax assets of $180 million at December 31, 2010 includes $151
million related to federal and state net operating loss carryforwards derived from equity transactions and $23 million
related to foreign operations. Additionally, since January 1, 2006, the Company has generated additional federal tax
benefits of $87.8 million related to equity transactions that are not included in the deferred tax asset table above.
Pursuant to accounting guidance, the aforementioned tax benefits related to equity deductions will be recognized by
crediting paid in capital, if and when they are realized by reducing the Company’s current income tax liability.
It is the practice and intention of the Company to reinvest the earnings of its non-U.S. subsidiaries in those
operations. Thus at December 31, 2010, no provision had been made for U.S. taxes on approximately $1 billion of
foreign earnings. Estimating the tax liability that would arise if these earnings were repatriated is not practicable at
this time.