Priceline 2010 Annual Report Download - page 153
Download and view the complete annual report
Please find page 153 of the 2010 Priceline annual report below. You can navigate through the pages in the report by either clicking on the pages listed below, or by using the keyword search tool below to find specific information within the annual report.
79
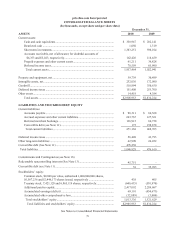
priceline.com Incorporated
CONSOLIDATED BALANCE SHEETS
(In thousands, except share and per share data)
December 31,
ASSETS 2010 2009
Current assets:
Cash and cash equivalents ............................................................................... $ 358,967 $ 202,141
Restricted cash ................................................................................................ 1,050
1,319
Short-term investments ................................................................................... 1,303,251
598,014
Accounts receivable, net of allowance for doubtful accounts of
$6,353 and $5,023, respectively ................................................................... 162,426 118,659
Prepaid expenses and other current assets ....................................................... 61,211 36,828
Deferred income taxes ..................................................................................... 70,559 65,980
Total current assets ........................................................................................ 1,957,464 1,022,941
Property and equipment, net ................................................................................... 39,739 30,489
Intangible assets, net ............................................................................................... 232,030 172,080
Goodwill ................................................................................................................. 510,894 350,630
Deferred income taxes ............................................................................................ 151,408 253,700
Other assets ............................................................................................................. 14,418 4,384
Total assets ...................................................................................................... $2,905,953 $1,834,224
LIABILITIES AND STOCKHOLDERS’ EQUITY
Current liabilities:
Accounts payable ............................................................................................ $ 90,311 $ 60,568
Accrued expenses and other current liabilities ................................................ 243,767 127,561
Deferred merchant bookings ........................................................................... 136,915 60,758
Convertible debt (see Note 11) ........................................................................ 175 159,878
Total current liabilities .................................................................................. 471,168 408,765
Deferred income taxes ............................................................................................ 56,440 43,793
Other long-term liabilities ...................................................................................... 42,990 24,052
Convertible debt (See Note 11) .............................................................................. 476,230 -
Total liabilities ...................................................................................................... 1,046,828 476,610
Commitments and Contingencies (see Note 16)
Redeemable noncontrolling interests (See Note 13) ............................................... 45,751 -
Convertible debt (see Note 11) ............................................................................... 38 35,985
Stockholders’ equity:
Common stock, $0.008 par value, authorized 1,000,000,000 shares,
56,567,236 and 52,446,173 shares issued, respectively .................................. 438
405
Treasury stock, 7,421,128 and 6,865,119 shares, respectively........................ (640,415) (510,970)
Additional paid-in capital ................................................................................ 2,417,092
2,289,867
Accumulated earnings (deficit) ....................................................................... 69,110
(454,673)
Accumulated other comprehensive loss .......................................................... (32,889)
(3,000)
Total stockholders’ equity ............................................................................. 1,813,336 1,321,629
Total liabilities and stockholders’ equity .................................................... $2,905,953 $1,834,224
See Notes to Consolidated Financial Statements.


