Priceline 2010 Annual Report Download - page 125
Download and view the complete annual report
Please find page 125 of the 2010 Priceline annual report below. You can navigate through the pages in the report by either clicking on the pages listed below, or by using the keyword search tool below to find specific information within the annual report.-
 1
1 -
2
-
3
-
4
-
5
-
6
-
7
-
8
-
9
-
10
-
11
-
12
-
13
-
14
-
15
-
16
-
17
-
18
-
19
-
20
-
21
-
22
-
23
-
24
-
25
-
26
-
27
-
28
-
29
-
30
-
31
-
32
-
33
-
34
-
35
-
36
-
37
-
38
-
39
-
40
-
41
-
42
-
43
-
44
-
45
-
46
-
47
-
48
-
49
-
50
-
51
-
52
-
53
-
54
-
55
-
56
-
57
-
58
-
59
-
60
-
61
-
62
-
63
-
64
-
65
-
66
-
67
-
68
-
69
-
70
-
71
-
72
-
73
-
74
-
75
-
76
-
77
-
78
-
79
-
80
-
81
-
82
-
83
-
84
-
85
-
86
-
87
-
88
-
89
-
90
-
91
-
92
-
93
-
94
-
95
-
96
-
97
-
98
-
99
-
100
-
101
-
102
-
103
-
104
-
105
-
106
-
107
-
108
-
109
-
110
-
111
-
112
-
113
-
114
-
 115
115 -
 116
116 -
 117
117 -
 118
118 -
 119
119 -
 120
120 -
 121
121 -
 122
122 -
 123
123 -
 124
124 -
 125
125 -
 126
126 -
 127
127 -
 128
128 -
 129
129 -
 130
130 -
 131
131 -
 132
132 -
 133
133 -
 134
134 -
 135
135 -
136
-
137
-
138
-
139
-
140
-
141
-
142
-
143
-
144
-
145
-
146
-
147
-
148
-
149
-
150
-
151
-
152
-
153
-
154
-
155
-
156
-
157
-
158
-
159
-
160
-
161
-
162
-
163
-
164
-
165
-
166
-
167
-
168
-
169
-
170
-
171
-
172
-
173
-
174
-
175
-
176
-
177
-
178
-
179
-
180
-
181
-
182
-
183
-
184
-
185
-
186
-
187
-
188
-
189
-
190
-
191
-
192
-
193
-
194
-
195
-
196
-
197
-
198
-
199
-
200
 |
 |

51
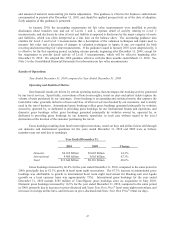
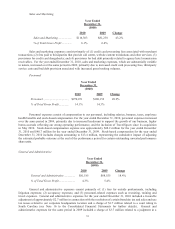
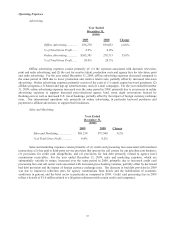
Sales and Marketing
Year Ended
December 31,
($000)
2010 2009 Change
Sales and Marketing .................. $116,303 $81,238 43.2%
% of Total Gross Profit ............. 6.1% 6.4%
Sales and marketing expenses consist primarily of (1) credit card processing fees associated with merchant
transactions; (2) fees paid to third-parties that provide call center, website content translations and other services; (3)
provisions for credit card chargebacks; and (4) provisions for bad debt primarily related to agency hotel commission
receivables. For the year ended December 31, 2010, sales and marketing expenses, which are substantially variable
in nature, increased over the same period in 2009, primarily due to increased credit card processing fees, third-party
service costs and bad debt provision associated with increased gross booking volumes.
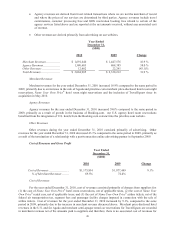
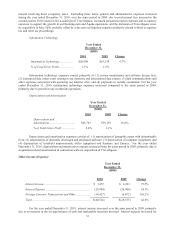
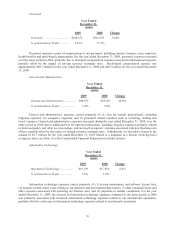
Personnel
Year Ended
December 31,
($000)
2010 2009 Change
Personnel .................................. $270,071 $180,152 49.9%
% of Total Gross Profit ............. 14.1% 14.3%
Personnel expenses consist of compensation to our personnel, including salaries, bonuses, taxes, employee
health benefits and stock-based compensation. For the year ended December 31, 2010, personnel expenses increased
over the same period in 2009, primarily due to increased headcount to support the growth of our business, higher
bonus accruals reflecting our strong operating performance, and the inclusion of TravelJigsaw since its acquisition
in May 2010. Stock-based compensation expense was approximately $68.2 million for the year ended December
31, 2010 and $40.7 million for the year ended December 31, 2009. Stock-based compensation for the year ended
December 31, 2010 includes charges amounting to $13.4 million, representing the cumulative impact of adjusting
the estimated probable outcome at the end of the performance period for certain outstanding unvested performance
share units.
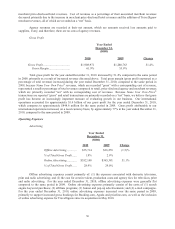
General and Administrative
Year Ended
December 31,
($000)
2010 2009 Change
General and Administrative ............... $81,185 $68,555 18.4%
% of Total Gross Profit ...................... 4.3% 5.4%
General and administrative expenses consist primarily of: (1) fees for outside professionals, including
litigation expenses; (2) occupancy expenses; and (3) personnel-related expenses such as recruiting, training and
travel expenses. General and administrative expenses for the year ended December 31, 2010 included a favorable
adjustment of approximately $2.7 million in connection with the resolution of certain franchise tax and sales and use
tax issues related to our corporate headquarters location and a charge of $1.7 million related to a court ruling in
South Carolina (see Note 16 to the Consolidated Financial Statements for further details). General and
administrative expenses for the same period in 2009 included a charge of $3.7 million related to a judgment in a