IBM 2013 Annual Report Download - page 84
Download and view the complete annual report
Please find page 84 of the 2013 IBM annual report below. You can navigate through the pages in the report by either clicking on the pages listed below, or by using the keyword search tool below to find specific information within the annual report.-
 1
1 -
 2
2 -
 3
3 -
 4
4 -
 5
5 -
 6
6 -
 7
7 -
 8
8 -
 9
9 -
 10
10 -
 11
11 -
 12
12 -
 13
13 -
 14
14 -
 15
15 -
 16
16 -
 17
17 -
 18
18 -
 19
19 -
 20
20 -
 21
21 -
 22
22 -
 23
23 -
 24
24 -
 25
25 -
 26
26 -
 27
27 -
 28
28 -
 29
29 -
 30
30 -
 31
31 -
 32
32 -
 33
33 -
 34
34 -
 35
35 -
 36
36 -
 37
37 -
 38
38 -
 39
39 -
 40
40 -
 41
41 -
 42
42 -
 43
43 -
 44
44 -
 45
45 -
 46
46 -
 47
47 -
 48
48 -
 49
49 -
 50
50 -
 51
51 -
 52
52 -
 53
53 -
 54
54 -
 55
55 -
 56
56 -
 57
57 -
 58
58 -
 59
59 -
 60
60 -
 61
61 -
 62
62 -
 63
63 -
 64
64 -
 65
65 -
 66
66 -
 67
67 -
 68
68 -
 69
69 -
 70
70 -
 71
71 -
 72
72 -
 73
73 -
 74
74 -
 75
75 -
 76
76 -
 77
77 -
 78
78 -
 79
79 -
 80
80 -
 81
81 -
 82
82 -
 83
83 -
 84
84 -
 85
85 -
 86
86 -
 87
87 -
 88
88 -
 89
89 -
 90
90 -
 91
91 -
 92
92 -
 93
93 -
 94
94 -
 95
95 -
 96
96 -
 97
97 -
 98
98 -
 99
99 -
 100
100 -
 101
101 -
 102
102 -
 103
103 -
 104
104 -
 105
105 -
 106
106 -
 107
107 -
 108
108 -
 109
109 -
 110
110 -
 111
111 -
 112
112 -
 113
113 -
 114
114 -
 115
115 -
 116
116 -
 117
117 -
 118
118 -
 119
119 -
 120
120 -
 121
121 -
 122
122 -
 123
123 -
 124
124 -
 125
125 -
 126
126 -
 127
127 -
 128
128 -
 129
129 -
 130
130 -
 131
131 -
 132
132 -
 133
133 -
 134
134 -
 135
135 -
 136
136 -
 137
137 -
 138
138 -
 139
139 -
 140
140 -
 141
141 -
 142
142 -
 143
143 -
 144
144 -
 145
145 -
 146
146 -
 147
147 -
 148
148 -
 149
149 -
 150
150 -
 151
151 -
 152
152 -
 153
153 -
 154
154
 |
 |

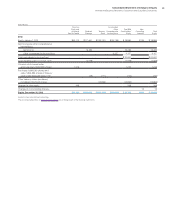
83
Consolidated Statement of Changes in Equity
International Business Machines Corporation and Subsidiary Companies
($ in millions)
Common
Stock and
Additional
Paid-In Capital
Retained
Earnings
Treasury
Stock
Accumulated
Other
Comprehensive
Income/(Loss)
Total IBM
Stockholders
Equity
’
Non-
Controlling
Interests
To t a l
Equity
2013
Equity, January 1, 2013 $50,110 $117,641 $(123,131)$(25,759)$ 18,860 $124 $ 18,984
Net income plus other comprehensive
income/(loss)
Net income 16,483 16,483 16,483
Other comprehensive income/(loss) 4,157 4,157 4,157
Total comprehensive income/(loss) $ 20,641 $ 20,641
Cash dividends paid—common stock (4,058)(4,058)(4,058)
Common stock issued under
employee plans (9,961,389 shares) 1,216 1,216 1,216
Purchases (1,666,069 shares) and
sales (1,849,883 shares) of treasury
stock under employee plans—net (25)(117)(142)(142)
Other treasury shares purchased,
not retired (73,121,942 shares) (13,993)(13,993)(13,993)
Changes in other equity 268 268 268
Changes in noncontrolling interests 13 13
Equity, December 31, 2013 $51,594 $130,042 $(137,242) $(21,602) $ 22,792 $137 $ 22,929
Amounts may not add due to rounding.
The accompanying notes on pages 84 through 146 are an integral part of the financial statements.
