IBM 2013 Annual Report Download - page 134
Download and view the complete annual report
Please find page 134 of the 2013 IBM annual report below. You can navigate through the pages in the report by either clicking on the pages listed below, or by using the keyword search tool below to find specific information within the annual report.-
 1
1 -
2
-
3
-
4
-
5
-
6
-
7
-
8
-
9
-
10
-
11
-
12
-
13
-
14
-
15
-
16
-
17
-
18
-
19
-
20
-
21
-
22
-
23
-
24
-
25
-
26
-
27
-
28
-
29
-
30
-
31
-
32
-
33
-
34
-
35
-
36
-
37
-
38
-
39
-
40
-
41
-
42
-
43
-
44
-
45
-
46
-
47
-
48
-
49
-
50
-
51
-
52
-
53
-
54
-
55
-
56
-
57
-
58
-
59
-
60
-
61
-
62
-
63
-
64
-
65
-
66
-
67
-
68
-
69
-
70
-
71
-
72
-
73
-
74
-
75
-
76
-
77
-
78
-
79
-
80
-
81
-
82
-
83
-
84
-
85
-
86
-
87
-
88
-
89
-
90
-
91
-
92
-
93
-
94
-
95
-
96
-
97
-
98
-
99
-
100
-
101
-
102
-
103
-
104
-
105
-
106
-
107
-
108
-
109
-
110
-
111
-
112
-
113
-
114
-
115
-
116
-
117
-
118
-
119
-
120
-
121
-
122
-
123
-
 124
124 -
 125
125 -
 126
126 -
 127
127 -
 128
128 -
 129
129 -
 130
130 -
 131
131 -
 132
132 -
 133
133 -
 134
134 -
 135
135 -
 136
136 -
 137
137 -
 138
138 -
 139
139 -
 140
140 -
 141
141 -
 142
142 -
 143
143 -
 144
144 -
145
-
146
-
147
-
148
-
149
-
150
-
151
-
152
-
153
-
154
 |
 |

Notes to Consolidated Financial Statements
International Business Machines Corporation and Subsidiary Companies
133
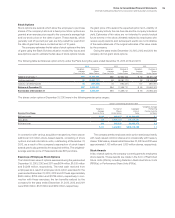
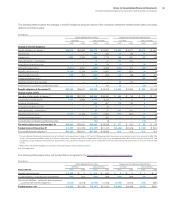
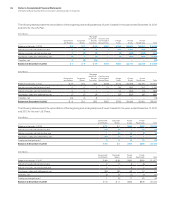
The table below presents the assumptions used to measure the net periodic (income)/cost and the year-end benefit obligations for retirement-
related benefit plans.
Defined Benefit Pension Plans
U.S. Plans Non-U.S. Plans
2013 2012 2011 2013 2012 2011
Weighted-average assumptions used to measure net
periodic (income)/cost for the year ended December 31
Discount rate 3.60% 4.20% 5.00% 3.23% 4.28% 4.33%
Expected long-term returns
on plan assets 8.00% 8.00% 8.00% 6.21% 6.26% 6.41%
Rate of compensation increase* N/A N/A N/A 2.51% 2.43% 2.37%
Weighted-average assumptions used to measure
benefit obligations at December 31
Discount rate 4.50% 3.60% 4.20% 3.32% 3.23% 4.28%
Rate of compensation increase* N/A N/A N/A 2.52% 2.51% 2.43%
* Rate of compensation increase is not applicable to the U.S. defined benefit pension plans as benefit accruals ceased December 31, 2007 for all participants.
N/A—Not applicable
Nonpension Postretirement Benefit Plans
U.S. Plan Non-U.S. Plans
2013 2012 2011 2013 2012 2011
Weighted-average assumptions used to measure net
periodic cost for the year ended December 31
Discount rate 3.30% 3.90% 4.80% 6.43% 7.37% 7.75%
Expected long-term returns
on plan assets 0.35% N/A N/A 9.01% 9.01% 9.07%
Weighted-average assumptions used to measure
benefit obligations at December 31
Discount rate 4.10% 3.30% 3.90% 7.78% 6.43% 7.37%
N/A—Not applicable
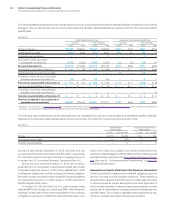
Discount Rate
The discount rate assumptions used for retirement-related benefit
plans accounting reflect the yields available on high-quality, fixed
income debt instruments at the measurement date. For the U.S. and
certain non-U.S. countries, a portfolio of high-quality corporate bonds
is used to construct a yield curve. The cash flows from the company’s
expected benefit obligation payments are then matched to the yield
curve to derive the discount rates. In other non-U.S. countries, where
the markets for high-quality long-term bonds are not generally as
well developed, a portfolio of long-term government bonds is used
as a base, to which a credit spread is added to simulate corporate
bond yields at these maturities in the jurisdiction of each plan, as the
benchmark for developing the respective discount rates.
For the U.S. defined benefit pension plans, the changes in the
discount rate assumptions impacted the net periodic (income)/cost
and the PBO. The changes in the discount rate assumptions resulted
in a decrease in 2013 net periodic income of $162 million, a decrease
in 2012 net periodic income of $258 million and a decrease in 2011
net periodic income of $171 million. The changes in the discount
rate assumptions resulted in a decrease in the PBO of $4,785 million
and an increase of $3,414 million at December 31, 2013 and 2012,
respectively.
For the nonpension postretirement benefit plans, the changes in
the discount rate assumptions had no material impact on net periodic
cost for the years ended December 31, 2013, 2012 and 2011 and
resulted in a decrease in the APBO of $298 million and an increase
of $252 million at December 31, 2013 and 2012, respectively.
Expected Long-Term Returns on Plan Assets
Expected returns on plan assets, a component of net periodic
(income)/cost, represent the expected long-term returns on plan
assets based on the calculated market-related value of plan assets.
Expected long-term returns on plan assets take into account long-
term expectations for future returns and the investment policies and
strategies as described on page 135. These rates of return are
developed by the company and are tested for reasonableness
against historical returns. The use of expected long-term returns on
plan assets may result in recognized pension income that is greater
or less than the actual returns of those plan assets in any given year.
Over time, however, the expected long-term returns are designed
to approximate the actual long-term returns, and therefore result in
a pattern of income and cost recognition that more closely matches
the pattern of the services provided by the employees. Differences