IBM 2013 Annual Report Download - page 43
Download and view the complete annual report
Please find page 43 of the 2013 IBM annual report below. You can navigate through the pages in the report by either clicking on the pages listed below, or by using the keyword search tool below to find specific information within the annual report.-
 1
1 -
2
-
3
-
4
-
5
-
6
-
7
-
8
-
9
-
10
-
11
-
12
-
13
-
14
-
15
-
16
-
17
-
18
-
19
-
20
-
21
-
22
-
23
-
24
-
25
-
26
-
27
-
28
-
29
-
30
-
31
-
32
-
 33
33 -
 34
34 -
 35
35 -
 36
36 -
 37
37 -
 38
38 -
 39
39 -
 40
40 -
 41
41 -
 42
42 -
 43
43 -
 44
44 -
 45
45 -
 46
46 -
 47
47 -
 48
48 -
 49
49 -
 50
50 -
 51
51 -
 52
52 -
 53
53 -
54
-
55
-
56
-
57
-
58
-
59
-
60
-
61
-
62
-
63
-
64
-
65
-
66
-
67
-
68
-
69
-
70
-
71
-
72
-
73
-
74
-
75
-
76
-
77
-
78
-
79
-
80
-
81
-
82
-
83
-
84
-
85
-
86
-
87
-
88
-
89
-
90
-
91
-
92
-
93
-
94
-
95
-
96
-
97
-
98
-
99
-
100
-
101
-
102
-
103
-
104
-
105
-
106
-
107
-
108
-
109
-
110
-
111
-
112
-
113
-
114
-
115
-
116
-
117
-
118
-
119
-
120
-
121
-
122
-
123
-
124
-
125
-
126
-
127
-
128
-
129
-
130
-
131
-
132
-
133
-
134
-
135
-
136
-
137
-
138
-
139
-
140
-
141
-
142
-
143
-
144
-
145
-
146
-
147
-
148
-
149
-
150
-
151
-
152
-
153
-
154
 |
 |

42 Management Discussion
International Business Machines Corporation and Subsidiary Companies
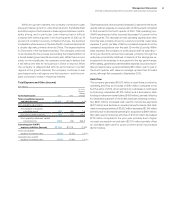
Total selling, general and administrative (SG&A) expense decreased
0.2 percent in 2013 versus 2012. The decrease was primarily driven
by the effects of currency (1 point) and base spending (1 point),
partially offset by acquisition-related spending (2 points). Operating
(non-GAAP) SG&A expense decreased 0.8 percent primarily driven
by the effects of currency (1 point) and lower base spending
(1 point), partially offset by acquisition-related spending (1 point).
The decrease was driven by lower SG&A—other expense, as the
company continues to shift its spending. The company is continuing
to drive productivity across the business, primarily through its enter-
prise productivity initiatives, and is reinvesting most of those savings
into the business to drive its growth areas. The increase in workforce
rebalancing charges was due to actions the company took in the
second quarter of 2013. Bad debt expense increased $106 million
in 2013 versus 2012, primarily driven by higher specific account
reserves. The accounts receivable provision coverage was 1.6 per-
cent at December 31, 2013, an increase of 20 basis points from
year-end 2012.
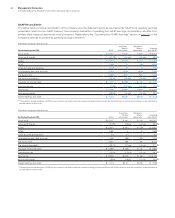
Other (Income) and Expense
($ in millions)
For the year ended December 31: 2013 2012
Yr.-to-Yr.
Percent
Change
Other (income) and expense
Foreign currency transaction
losses/(gains) $(260)$(240) 8.4%
(Gains)/losses on derivative
instruments 166 72 132.5
Interest income (74)(109) (32.2)
Net (gains)/losses from securities
and investment assets (29)(55) (48.0)
Other (131)(511) ( 74.4)
Total consolidated other
(income) and expense $(327)$(843) (61.2)%
Non-operating adjustment
Acquisition-related charges (16)(13) 17.4
Operating (non-GAAP)
other (income) and expense $(343)$(857) (60.0)%
Other (income) and expense was income of $327 million and $843
million in 2013 and 2012, respectively. The decrease in income of
$516 million in 2013 was primarily driven by lower income from dives-
titures ($405 million) driven by the gain associated with the divested
RSS business ($446 million) in 2012 reflected in Other in the table
above, and increased losses on derivative instruments ($95 million)
due to foreign currency rate volatility year to year.
Research, Development and Engineering
($ in millions)
For the year ended December 31: 2013 2012
Yr.-to-Yr.
Percent
Change
Total consolidated research,
development and engineering $6,226 $6,302 (1.2)%
Non-operating adjustment
Non-operating retirement-related
(costs)/income (57) 20 NM
Operating (non-GAAP) research,
development and engineering $6,170 $6,322 (2.4)%
NM—Not meaningful
The company continues to invest in research and development,
focusing its investments on high-value, high-growth opportunities
and to extend its technology leadership. Total research, development
and engineering (RD&E) expense decreased 1.2 percent in 2013
versus 2012, primarily driven by lower base spending (3 points), par-
tially offset by acquisitions (2 points). Operating (non-GAAP) RD&E
expense decreased 2.4 percent in 2013 compared to the prior year
primarily driven by lower base spending (4 points), partially offset by
acquisitions (2 points). Overall, the investment in RD&E represented
6.2 percent of revenue in 2013, compared to 6.0 percent in 2012.
Intellectual Property and Custom Development Income
($ in millions)
For the year ended December 31: 2013 2012
Yr.-to-Yr.
Percent
Change
Sales and other transfers
of intellectual property $352 $ 324 8.7%
Licensing/royalty-based fees 150 251 (40.0)
Custom development income 320 500 (36.0)
To t a l $822 $1,074 (23.5)%
The timing and amount of sales and other transfers of intellectual
property (IP) may vary significantly from period to period depending
upon timing of divestitures, industry consolidation, economic con-
ditions and the timing of new patents and know-how development.
There were no significant individual IP transactions in 2013 or 2012.
Custom development income declined 36 percent compared to
the prior year due to a reduction in payments from the company’s
technology alliance partners.
Interest Expense
($ in millions)
For the year ended December 31: 2013 2012
Yr.-to-Yr.
Percent
Change
Interest expense
To t a l $402 $459 (12.5)%