IBM 2013 Annual Report Download - page 110
Download and view the complete annual report
Please find page 110 of the 2013 IBM annual report below. You can navigate through the pages in the report by either clicking on the pages listed below, or by using the keyword search tool below to find specific information within the annual report.-
 1
1 -
2
-
3
-
4
-
5
-
6
-
7
-
8
-
9
-
10
-
11
-
12
-
13
-
14
-
15
-
16
-
17
-
18
-
19
-
20
-
21
-
22
-
23
-
24
-
25
-
26
-
27
-
28
-
29
-
30
-
31
-
32
-
33
-
34
-
35
-
36
-
37
-
38
-
39
-
40
-
41
-
42
-
43
-
44
-
45
-
46
-
47
-
48
-
49
-
50
-
51
-
52
-
53
-
54
-
55
-
56
-
57
-
58
-
59
-
60
-
61
-
62
-
63
-
64
-
65
-
66
-
67
-
68
-
69
-
70
-
71
-
72
-
73
-
74
-
75
-
76
-
77
-
78
-
79
-
80
-
81
-
82
-
83
-
84
-
85
-
86
-
87
-
88
-
89
-
90
-
91
-
92
-
93
-
94
-
95
-
96
-
97
-
98
-
99
-
 100
100 -
 101
101 -
 102
102 -
 103
103 -
 104
104 -
 105
105 -
 106
106 -
 107
107 -
 108
108 -
 109
109 -
 110
110 -
 111
111 -
 112
112 -
 113
113 -
 114
114 -
 115
115 -
 116
116 -
 117
117 -
 118
118 -
 119
119 -
 120
120 -
121
-
122
-
123
-
124
-
125
-
126
-
127
-
128
-
129
-
130
-
131
-
132
-
133
-
134
-
135
-
136
-
137
-
138
-
139
-
140
-
141
-
142
-
143
-
144
-
145
-
146
-
147
-
148
-
149
-
150
-
151
-
152
-
153
-
154
 |
 |

Notes to Consolidated Financial Statements
International Business Machines Corporation and Subsidiary Companies
109
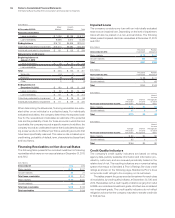
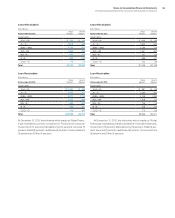
Lease Receivables
($ in millions)
At December 31, 2013:
Major
Markets
Growth
Markets
Credit rating
AAA – A A- $ 743 $ 68
A+ – A- 1,513 168
BBB+ – BBB- 2,111 957
BB+ – BB 1,393 350
BB- – B+ 595 368
B – B- 365 214
CCC+ – D 76 74
To t a l $6,796 $2,200
Loan Receivables
($ in millions)
At December 31, 2013:
Major
Markets
Growth
Markets
Credit rating
AAA – A A- $ 1,151 $ 125
A+ – A- 2,344 307
BBB+ – BBB- 3,271 1,745
BB+ – BB 2,158 638
BB- – B+ 922 672
B – B- 565 391
CCC+ – D 118 134
To t a l $10,529 $4,012
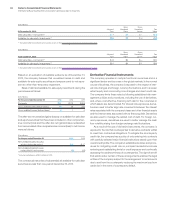
At December 31, 2013, the industries which made up Global Financ-
ing’s receivables portfolio consisted of: Financial (39 percent),
Government (14 percent), Manufacturing (14 percent), Services (8
percent), Retail (8 percent), Healthcare (6 percent), Communications
(6 percent) and Other (4 percent).
Lease Receivables
($ in millions)
At December 31, 2012:
Major
Markets
Growth
Markets
Credit rating
AAA – A A- $ 646 $ 86
A+ – A- 1,664 223
BBB+ – BBB- 2,285 776
BB+ – BB 1,367 450
BB- – B+ 552 418
B – B- 399 127
CCC+ – D 124 58
To t a l $7,036 $2,138
Loan Receivables
($ in millions)
At December 31, 2012:
Major
Markets
Growth
Markets
Credit rating
AAA – A A- $ 887 $ 148
A+ – A- 2,286 382
BBB+ – BBB- 3,139 1,333
BB+ – BB 1,878 773
BB- – B+ 758 718
B – B- 548 218
CCC+ – D 170 99
To t a l $9,666 $3,670
At December 31, 2012, the industries which made up Global
Financing’s receivables portfolio consisted of: Financial (38 percent),
Government (16 percent), Manufacturing (14 percent), Retail (9 per-
cent), Services (7 percent), Healthcare (6 percent), Communications
(6 percent) and Other (4 percent).