IBM 2013 Annual Report Download - page 49
Download and view the complete annual report
Please find page 49 of the 2013 IBM annual report below. You can navigate through the pages in the report by either clicking on the pages listed below, or by using the keyword search tool below to find specific information within the annual report.-
 1
1 -
2
-
3
-
4
-
5
-
6
-
7
-
8
-
9
-
10
-
11
-
12
-
13
-
14
-
15
-
16
-
17
-
18
-
19
-
20
-
21
-
22
-
23
-
24
-
25
-
26
-
27
-
28
-
29
-
30
-
31
-
32
-
33
-
34
-
35
-
36
-
37
-
38
-
 39
39 -
 40
40 -
 41
41 -
 42
42 -
 43
43 -
 44
44 -
 45
45 -
 46
46 -
 47
47 -
 48
48 -
 49
49 -
 50
50 -
 51
51 -
 52
52 -
 53
53 -
 54
54 -
 55
55 -
 56
56 -
 57
57 -
 58
58 -
 59
59 -
60
-
61
-
62
-
63
-
64
-
65
-
66
-
67
-
68
-
69
-
70
-
71
-
72
-
73
-
74
-
75
-
76
-
77
-
78
-
79
-
80
-
81
-
82
-
83
-
84
-
85
-
86
-
87
-
88
-
89
-
90
-
91
-
92
-
93
-
94
-
95
-
96
-
97
-
98
-
99
-
100
-
101
-
102
-
103
-
104
-
105
-
106
-
107
-
108
-
109
-
110
-
111
-
112
-
113
-
114
-
115
-
116
-
117
-
118
-
119
-
120
-
121
-
122
-
123
-
124
-
125
-
126
-
127
-
128
-
129
-
130
-
131
-
132
-
133
-
134
-
135
-
136
-
137
-
138
-
139
-
140
-
141
-
142
-
143
-
144
-
145
-
146
-
147
-
148
-
149
-
150
-
151
-
152
-
153
-
154
 |
 |

48 Management Discussion
International Business Machines Corporation and Subsidiary Companies
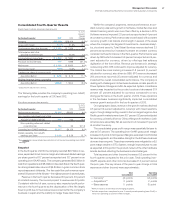
Pre-tax income declined 11.1 percent year to year and the pre-tax
margin was 25.1 percent. Net income increased 6.0 percent and
the net income margin was 22.3 percent, an increase of 2.4 points
year to year. The effective tax rate for the fourth quarter was 11.2
percent, compared to 25.5 percent in the prior year. The decrease
in the tax rate included substantial benefits from tax audit settle-
ments and a modest reduction in the ongoing tax rate. Specifically,
the fourth-quarter tax rate included the conclusion of the U.S. tax
audit for the three-year period from 2008-2010. The company
accrues taxes for uncertain tax matters in the normal tax rate. The
conclusion of the audit in November 2013 resulted in a reduction
of tax expense previously recorded in the normal tax rate. While the
audit closure had the most significant impact, there were additional
discrete items impacting the rate in the fourth quarter. Operating
(non-GAAP) pre-tax income declined 8.4 percent year to year and
the operating (non-GAAP) pre-tax margin was 26.8 percent, down
0.8 points year to year driven entirely by the hardware business.
Operating (non-GAAP) net income increased 8.0 percent and the
operating (non-GAAP) net income margin of 23.9 percent increased
3.0 points compared to the prior year. The operating (non-GAAP)
effective tax rate was 11.0 percent versus 24.4 percent in the fourth
quarter of 2012 driven by the same factors described above.
Diluted earnings per share of $5.73 increased 11.7 percent versus
the prior year. In the fourth quarter, the company repurchased 33.2
million shares of its common stock. Operating (non-GAAP) diluted
earnings per share of $6.13 increased $0.74 or 13.7 percent versus
the fourth quarter of 2012 driven by the following factors:
• Revenue decrease at actual rates $ (0.29)
• Margin expansion $ 0.73
• Common stock repurchases $ 0.30
The operating (non-GAAP) earnings per share growth in the fourth
quarter was achieved through a combination of: continued momen-
tum in key growth areas, which drove a mix to higher-value Software
and GBS; yield from productivity initiatives; a modest improvement
in the ongoing tax rate, along with substantial benefits from tax
audit settlements; and, the effective use of cash to repurchase
common shares.
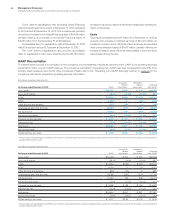
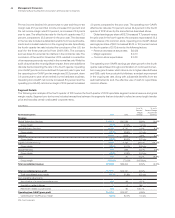
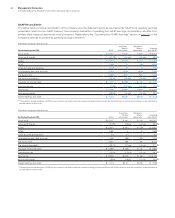
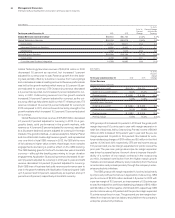
Segment Details
The following is an analysis of the fourth quarter of 2013 versus the fourth quarter of 2012 reportable segment external revenue and gross
margin results. Segment pre-tax income includes transactions between the segments that are intended to reflect an arms-length transfer
price and excludes certain unallocated corporate items.
($ in millions)
For the fourth quarter: 2013 2012
Yr.-to-Yr.
Percent/
Margin
Change
Yr.-to-Yr.
Percent Change
Adjusted for
Currency
Revenue
Global Technology Services $ 9,917 $10,284 (3.6)% (0.6)%
Gross margin 38.8% 37.6% 1.2 pts.
Global Business Services 4,747 4,720 0.6%4.3%
Gross margin 30.7% 29.9% 0.7 pts.
Software 8,140 7,915 2.8%3.5%
Gross margin 90.5% 90.6% (0.1) pts.
Systems and Technology 4,261 5,763 (26.1)% (25.4)%
Gross margin 38.6% 44.1% (5.5) pts.
Global Financing 534 535 (0.1)% 2.6%
Gross margin 43.3% 43.8% (0.4) pts.
Other 100 87 15.2%16.9%
Gross margin (234.8)% (73.2)% (161.6) pts.
Total consolidated revenue $27,699 $29,304 (5.5)% (3.5)%
Total consolidated gross profit $14,315 $15,167 (5.6)%
Total consolidated gross margin 51.7% 51.8% (0.1) pts.
Non-operating adjustments
Amortization of acquired intangible assets 103 99 4.1%
Acquisition-related charges 10NM
Retirement-related costs/(income) 154 60 155.7%
Operating (non-GAAP) gross profit $14,574 $15,327 (4.9)%
Operating (non-GAAP) gross margin 52.6% 52.3% 0.3 pts.
NM—Not meaningful