IBM 2013 Annual Report Download - page 48
Download and view the complete annual report
Please find page 48 of the 2013 IBM annual report below. You can navigate through the pages in the report by either clicking on the pages listed below, or by using the keyword search tool below to find specific information within the annual report.-
 1
1 -
2
-
3
-
4
-
5
-
6
-
7
-
8
-
9
-
10
-
11
-
12
-
13
-
14
-
15
-
16
-
17
-
18
-
19
-
20
-
21
-
22
-
23
-
24
-
25
-
26
-
27
-
28
-
29
-
30
-
31
-
32
-
33
-
34
-
35
-
36
-
37
-
 38
38 -
 39
39 -
 40
40 -
 41
41 -
 42
42 -
 43
43 -
 44
44 -
 45
45 -
 46
46 -
 47
47 -
 48
48 -
 49
49 -
 50
50 -
 51
51 -
 52
52 -
 53
53 -
 54
54 -
 55
55 -
 56
56 -
 57
57 -
 58
58 -
59
-
60
-
61
-
62
-
63
-
64
-
65
-
66
-
67
-
68
-
69
-
70
-
71
-
72
-
73
-
74
-
75
-
76
-
77
-
78
-
79
-
80
-
81
-
82
-
83
-
84
-
85
-
86
-
87
-
88
-
89
-
90
-
91
-
92
-
93
-
94
-
95
-
96
-
97
-
98
-
99
-
100
-
101
-
102
-
103
-
104
-
105
-
106
-
107
-
108
-
109
-
110
-
111
-
112
-
113
-
114
-
115
-
116
-
117
-
118
-
119
-
120
-
121
-
122
-
123
-
124
-
125
-
126
-
127
-
128
-
129
-
130
-
131
-
132
-
133
-
134
-
135
-
136
-
137
-
138
-
139
-
140
-
141
-
142
-
143
-
144
-
145
-
146
-
147
-
148
-
149
-
150
-
151
-
152
-
153
-
154
 |
 |

47
Management Discussion
International Business Machines Corporation and Subsidiary Companies
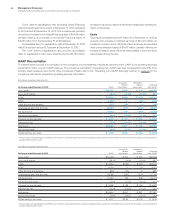
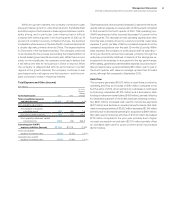
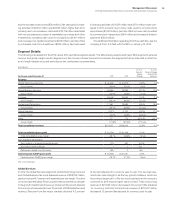
Consolidated Fourth-Quarter Results
($ and shares in millions except per share amounts)
For the fourth quarter: 2013 2012
Yr.-to-Yr.
Percent/
Margin
Change
Revenue $27,699 $29,304 (5.5)%*
Gross profit margin 51.7% 51.8% (0.1) pts.
Total expense and other (income) $ 7,353 $ 7,336 0.2%
Total expense and other
(income)-to-revenue ratio 26.5% 25.0% 1.5 pts.
Income before income taxes $ 6,962 $ 7,831 (11.1)%
Provision for income taxes 777 1,998 (61.1)%
Net income $ 6,185 $ 5,833 6.0%
Net income margin 22.3% 19.9%2.4 pts.
Earnings per share of common stock
Assuming dilution $ 5.73 $ 5.13 11.7%
Weighted-average shares outstanding
Assuming dilution 1,080.0 1,136.4 (5.0)%
* (3.5) percent adjusted for currency.
The following table provides the company’s operating (non-GAAP)
earnings for the fourth quarter of 2013 and 2012.
($ in millions except per share amounts)
For the fourth quarter: 2013 2012
Yr.-to-Yr.
Percent
Change
Net income as reported $6,185 $5,833 6.0%
Non-operating adjustments (net of tax)
Acquisition-related charges 268 243 10.6
Non-operating retirement-related
costs/(income) 164 53 207.8
Operating (non-GAAP) earnings* $6,617 $ 6,129 8.0%
Diluted operating (non-GAAP)
earnings per share $ 6.13 $ 5.39 13.7%
* See page 52 for a more detailed reconciliation of net income to operating (non-GAAP)
earnings.
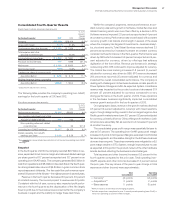
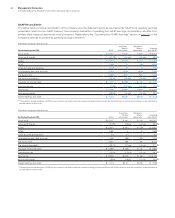
Snapshot
In the fourth quarter of 2013, the company reported $27.7 billion in rev-
enue, expanded its net income margin and delivered diluted earnings
per share growth of 11.7 percent as reported and 13.7 percent on an
operating (non-GAAP) basis. The company generated $6.5 billion in
cash from operations and $8.4 billion in free cash flow in the fourth quar-
ter driving shareholder returns of $6.8 billion in gross common stock
repurchases and dividends. The free cash flow performance repre-
sented 56 percent of the full year—the highest percent in several years.
Revenue in the fourth quarter decreased 5.5 percent, 3.5 percent
at constant currency. The currency impact to revenue was 2.0 points.
Consistent with the full year, currency also impacted profit perfor-
mance in the fourth quarter as the depreciation of the Yen largely
flows to profit due to the local services content within the company’s
business in Japan and the inability to hedge these cash flows.
Within the company’s segments, revenue performance at con-
stant currency was led by growth in Software, Global Services and
Global Financing which was more than offset by a decline in STG.
Software revenue improved 2.8 percent as reported and 4 percent
at constant currency. Performance was broad-based with constant
currency growth in all brands and strength in several of the areas
where the company has targeted it investments—business analyt-
ics, cloud and security. Total Global Services revenue declined 2.3
percent as reported, but increased 1 percent at constant currency
consistent with performance in the third-quarter. Performance was
driven by GBS which increased 0.6 percent as reported and 4 per-
cent adjusted for currency, driven by offerings that address
digitization of the front office. Revenue performance in strategic
outsourcing within GTS continued to improve, adjusted for currency.
The Global Services backlog increased 1.8 percent (5 percent
adjusted for currency), also driven by GBS. STG revenue decreased
26.1 percent as reported (25 percent adjusted for currency) and
impacted the overall consolidated performance. The company is
dealing with challenges in its hardware business models specific to
Power Systems, Storage and x86. As expected, System z mainframe
revenue was impacted by the product cycle and decreased 37.4
percent (37 percent adjusted for currency) compared to a very
strong performance in the fourth quarter of 2012. These dynamics
in the hardware business significantly impacted consolidated
revenue growth and profit in the fourth quarter of 2013.
On a geographic basis, revenue in the growth markets declined
9.5 percent (6 percent adjusted for currency) with mixed results by
region, though disappointing overall. In the two largest regions, Asia
Pacific growth markets were down 15.7 percent (12 percent adjusted
for currency), primarily driven by China, while growth markets in Latin
America were essentially flat as reported, but increased 5 percent
at constant currency.
The consolidated gross profit margin was essentially flat year to
year at 51.7 percent. The operating (non-GAAP) gross profit margin
increased 0.3 points to 52.6 percent. Margins expanded in both Global
Services segments, and the relative strength in the Software business
drove an improving mix. These improvements were mitigated by a 5.5
point margin decline in STG. System z margin improved year to year
as expected at this point in the product cycle, but the other hardware
brands declined reflecting the business model challenges.
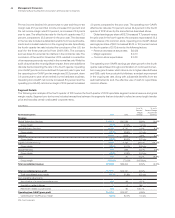
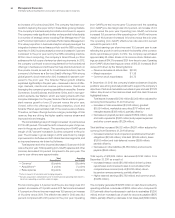
Total expense and other (income) increased 0.2 percent in the
fourth quarter compared to the prior year. Total operating (non-
GAAP) expense and other (income) decreased 1.0 percent versus
the prior year. The key drivers of the year-to-year change in total
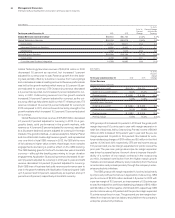
expense and other (income) were approximately:
Total Operating
Consolidated (non-GAAP)
•
Currency* (2)
points (2)
points
• Acquisitions** 2 points 2 points
• Base expense 0 points (1) point
* Reflects impacts of translation and hedging programs.
** Includes acquisitions completed in prior 12-month period; operating (non-GAAP) is
net of non-operating acquisition-related charges.