IBM 2013 Annual Report Download - page 46
Download and view the complete annual report
Please find page 46 of the 2013 IBM annual report below. You can navigate through the pages in the report by either clicking on the pages listed below, or by using the keyword search tool below to find specific information within the annual report.-
 1
1 -
2
-
3
-
4
-
5
-
6
-
7
-
8
-
9
-
10
-
11
-
12
-
13
-
14
-
15
-
16
-
17
-
18
-
19
-
20
-
21
-
22
-
23
-
24
-
25
-
26
-
27
-
28
-
29
-
30
-
31
-
32
-
33
-
34
-
35
-
 36
36 -
 37
37 -
 38
38 -
 39
39 -
 40
40 -
 41
41 -
 42
42 -
 43
43 -
 44
44 -
 45
45 -
 46
46 -
 47
47 -
 48
48 -
 49
49 -
 50
50 -
 51
51 -
 52
52 -
 53
53 -
 54
54 -
 55
55 -
 56
56 -
57
-
58
-
59
-
60
-
61
-
62
-
63
-
64
-
65
-
66
-
67
-
68
-
69
-
70
-
71
-
72
-
73
-
74
-
75
-
76
-
77
-
78
-
79
-
80
-
81
-
82
-
83
-
84
-
85
-
86
-
87
-
88
-
89
-
90
-
91
-
92
-
93
-
94
-
95
-
96
-
97
-
98
-
99
-
100
-
101
-
102
-
103
-
104
-
105
-
106
-
107
-
108
-
109
-
110
-
111
-
112
-
113
-
114
-
115
-
116
-
117
-
118
-
119
-
120
-
121
-
122
-
123
-
124
-
125
-
126
-
127
-
128
-
129
-
130
-
131
-
132
-
133
-
134
-
135
-
136
-
137
-
138
-
139
-
140
-
141
-
142
-
143
-
144
-
145
-
146
-
147
-
148
-
149
-
150
-
151
-
152
-
153
-
154
 |
 |

45
Management Discussion
International Business Machines Corporation and Subsidiary Companies
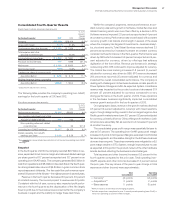
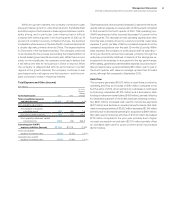
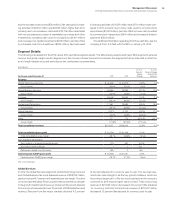
Cash Flow
The company’s cash flows from operating, investing and financing
activities, as reflected in the Consolidated Statement of Cash Flows
on page 81, is summarized in the table below. These amounts include
the cash flows associated with the Global Financing business.
($ in millions)
For the year ended December 31: 2013 2012
Net cash provided by/(used in)
Operating activities $17,485 $ 19,586
Investing activities (7,326) (9,004)
Financing activities (9,883) (11,976)
Effect of exchange rate changes
on cash and cash equivalents 28 (116)
Net change in cash and cash equivalents $ 304 $ (1,511)
Net cash provided by operating activities decreased by $2,102
million in 2013 driven by operational performance and the following
key factors:
• A net increase in the use of cash for taxes (deferred, payable,
reserves) of $2,200 million primarily driven by an increase in
cash income tax payments;
• A net decrease from compensation and benefits of approxi-
mately $600 million primarily driven by reductions in
performance-related compensation;
• An increase in the use of cash of $438 million related to the
fulfillment of services contracts;
• Higher cash requirements for inventory ($337 million);
• Higher cash payments for workforce rebalancing of
$332 million; and
• Lower net income of $121 million; partially offset by
• Lower cash used by accounts receivables of $823 million
primarily driven by financing receivables; and
• A decrease in cash funding related to retirement-related
plans of $723 million driven by a decrease in nonpension
postretirement contributions.
Net cash used in investing activities decreased $1,679 million driven by:
• An increase in cash of $1,232 million from net sales of
marketable securities and other investments;
• A net decrease of $539 million in cash used for capital
expenditures; and
• A net decrease of $363 million in cash used for acquisitions/
divestitures; partially offset by
• A net decrease in cash provided by non-operating financing
receivables of $455 million.
Net cash used in financing activities decreased $2,094 million as
compared to the prior year driven by the following factors:
• An increase in net cash from debt transactions (including
short-term borrowings) of $4,708 million; partially offset by
• An increase of $2,330 million of net cash used for common
stock transactions; and
• An increase in dividend payments of $285 million.
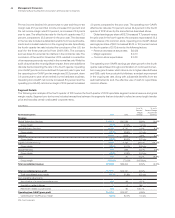
Noncurrent Assets and Liabilities
($ in millions)
At December 31: 2013 2012
Noncurrent assets $74,873 $69,780
Long-term debt $32,856 $24,088
Noncurrent liabilities (excluding debt) $30,284 $32,516
The increase in noncurrent assets of $5,093 million ($6,521 million
adjusted for currency) was driven by:
• An increase of $4,607 million ($4,578 million adjusted for
currency) in prepaid pension assets primarily driven by plan
remeasurements; and
• An increase in intangible assets and goodwill of $2,022 million
($2,385 million adjusted for currency) primarily driven by
current year acquisitions; partially offset by
• A decrease of $922 million in deferred taxes ($753 million
adjusted for currency) driven by retirement-related plans
activity.
Long-term debt increased by $8,768 million ($8,779 million adjusted
for currency) primarily driven by new debt issuances of $12,898 million,
partially offset by reclasses to short-term debt of $3,949 million.
Other noncurrent liabilities, excluding debt, decreased $2,232
million ($1,723 million adjusted for currency) primarily driven by:
• A decrease in retirement and nonpension benefit obligations of
$4,176 million driven by plan remeasurements; partially offset by
• An increase of $2,326 million in other liabilities primarily
driven by deferred tax increases related to the pension plan
remeasurements.
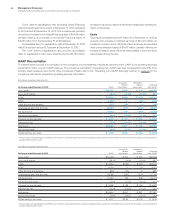
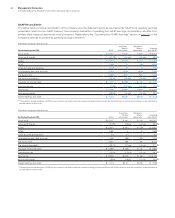
Debt
The company’s funding requirements are continually monitored and
strategies are executed to manage the overall asset and liability
profile. Additionally, the company maintains sufficient flexibility to
access global funding sources as needed.
($ in millions)
At December 31: 2013 2012
Total company debt $39,718 $33,269
Total Global Financing segment debt $27,504 $24,501
Debt to support external clients 24,471 21,583
Debt to support internal clients 3,033 2,919
Global Financing provides financing predominantly for the com-
pany’s external client assets, as well as for assets under contract by
other IBM units. These assets, primarily for Global Services, gener-
ate long-term, stable revenue streams similar to the Global Financing
asset portfolio. Based on their attributes, these Global Services
assets are leveraged with the balance of the Global Financing asset
base. The debt analysis above is further detailed in the Global
Financing section on page 75.
Given the significant leverage, the company presents a debt-to-
capitalization ratio which excludes Global Financing debt and equity
as management believes this is more representative of the com-
pany’s core business operations. This ratio can vary from period to
period as the company manages its global cash and debt positions.